This is documentation for the next version of Grafana documentation. For the latest stable release, go to the latest version.
Introduction to Grafana Alerting
Grafana Alerting lets you define alert rules across multiple data sources and manage notifications with flexible routing.
Built on the Prometheus alerting model, it integrates with the Grafana stack to provide a scalable and effective alerting setup across a wide range of environments.
Tip
For a hands-on introduction, refer to Getting started with Grafana Alerting tutorials.
How it works at a glance
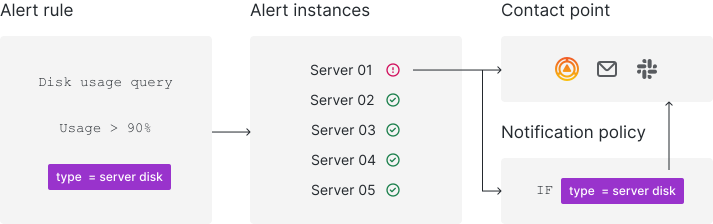
- Grafana Alerting periodically evaluates alert rules by executing their data source queries and checking their conditions.
- Each alert rule can produce multiple alert instances—one per time series or dimension.
- If a condition is breached, an alert instance fires.
- Firing (and resolved) alert instances are sent for notifications, either directly to a contact point or through notification policies for more flexibility.
Fundamentals
The following concepts are key to your understanding of how Grafana Alerting works.
Alert rules
An alert rule consists of one or more queries and expressions that select the data you want to measure. It also contains a condition, which is the threshold that an alert rule must meet or exceed to fire.
In the alert rule, choose the contact point or notification policies to determine how to receive the alert notifications.
Alert rule evaluation
Alert rules are frequently evaluated and the state of their alert instances is updated accordingly. Only alert instances that are in a firing or resolved state are sent in notifications.
Alert instances
Each alert rule can produce multiple alert instances (also known as alerts) - one alert instance for each time series or dimension. This allows you to observe multiple resources in a single expression.
sum by(cpu) (
  rate(node_cpu_seconds_total{mode!="idle"}[1m])
)
A rule using the PromQL expression above creates as many alert instances as the amount of CPUs after the first evaluation, enabling a single rule to report the status of each CPU.
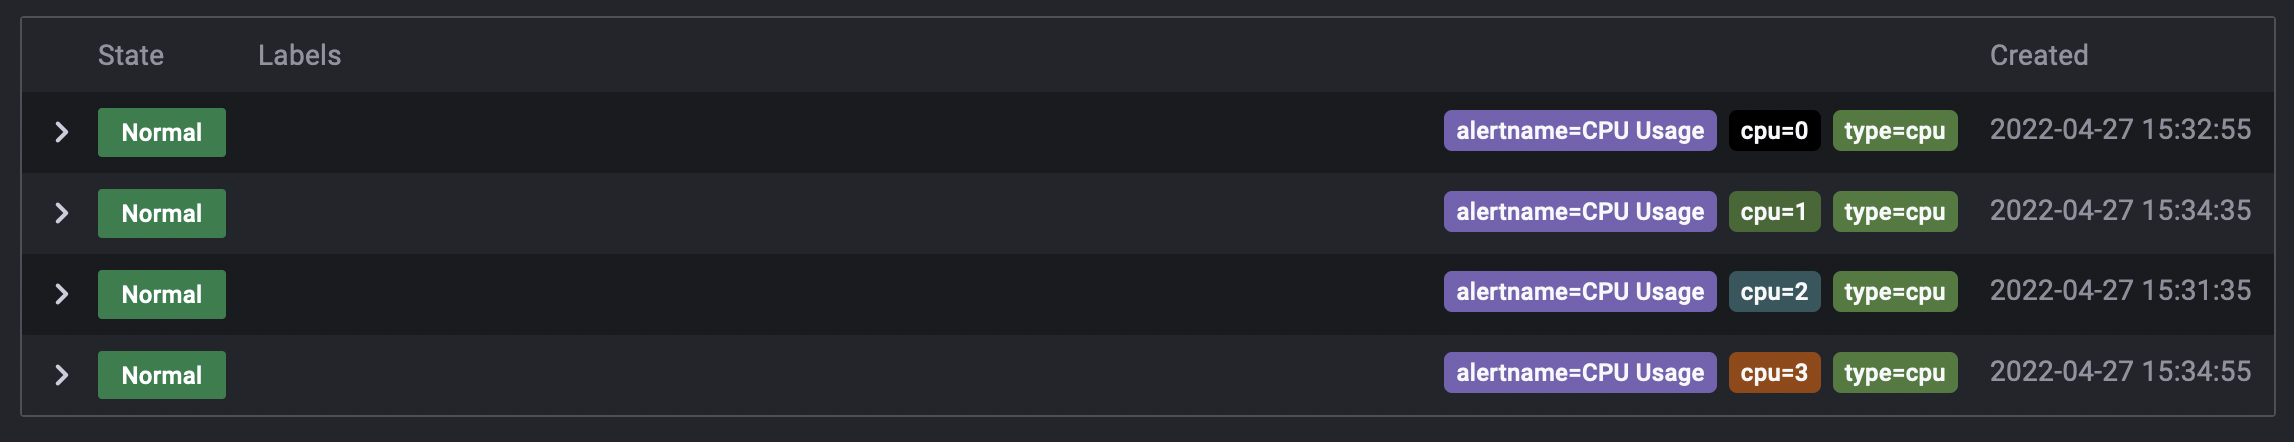
For a demo, see the multi-dimensional alerts example.
Contact points
Contact points determine the notification message and where notifications are sent. For example, you might have a contact point that sends notifications to an email address, to Slack, to an incident management system (IRM) such as Grafana IRM or PagerDuty, or to a webhook.
Notification messages
By default, notification messages include alert details, such as the number of alerts, their status, and annotations to help responders address alert issues. Notification messages can also be customized.
In the alert rule, you can choose a contact point to receive the alert notifications or use notification policies instead.
Notification policies
Notification policies are an advanced option for handling alert notifications by distinct scopes, such as by team or service—ideal for managing large alerting systems.
Notification policies routes alerts to contact points via label matching. They are defined in a tree structure, where the root of the notification policy tree is the Default notification policy, which ensures all alert instances are handled.

Each notification policy decides where to send the alert (contact point) and when to send the notification (timing options).
Notification grouping
To reduce alert noise, Grafana Alerting groups related firing alerts into a single notification by default. You can customize this behavior in the alert rule or notification policy settings.
Silences and mute timings
Silences and mute timings allow you to pause notifications without interrupting alert rule evaluation. Use a silence to pause notifications on a one-time basis, such as during a maintenance window; and use mute timings to pause notifications at regular intervals, such as evenings and weekends.


