This is documentation for the next version of Grafana. For the latest stable release, go to the latest version.
Correlations
You can create interactive links for Explore visualizations to run queries related to presented data by setting up Correlations.
A correlation defines how data in one data source is used to query data in another data source. Some examples:
- an application name returned in a logs data source can be used to query metrics related to that application in a metrics data source, or
- a user name returned by an SQL data source can be used to query logs related to that particular user in a logs data source
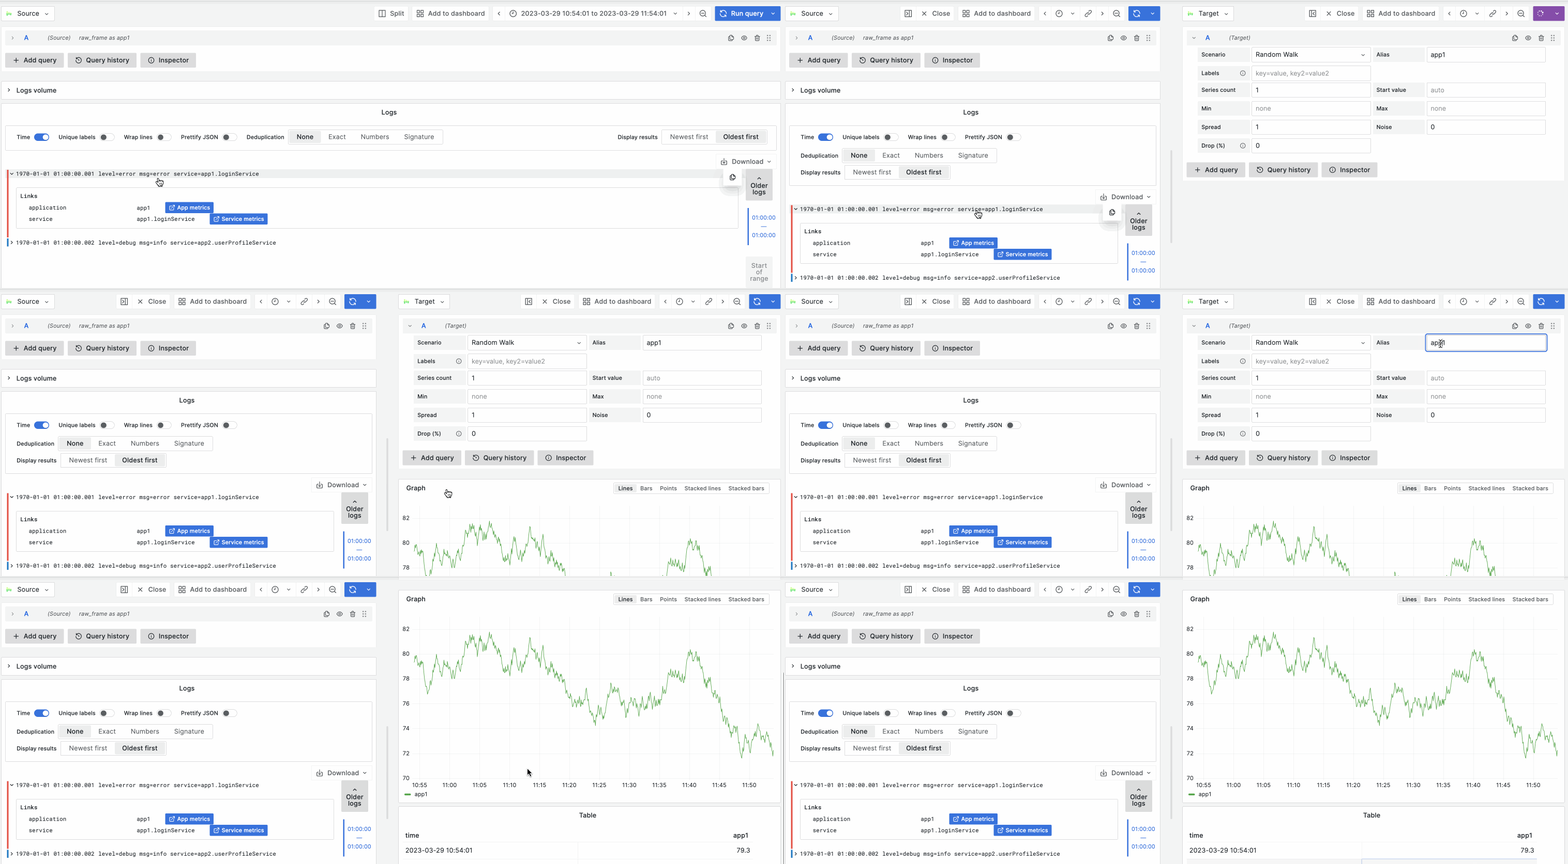
Explore takes user-defined correlations to display links inside the visualizations. You can click on a link to run the related query and see results in Explore Split View.
Explore visualizations that currently support showing links based on correlations:
You can configure correlations using provisioning, the Administration > Plugins and data > Correlations page in Grafana or directly in Explore.
Example of how links work in Explore once set up

See also:


