This is documentation for the next version of Grafana documentation. For the latest stable release, go to the latest version.
What’s new in Grafana v10.2
Welcome to Grafana 10.2! Read on to learn about changes to dashboards and visualizations, data sources, security and authentication, and more. We’re particularly excited about the addition of generative AI features for dashboards, a new kind of basic role, and improvements to visualization transformations.
For even more detail about all the changes in this release, refer to the changelog. For the specific steps we recommend when you upgrade to v10.2, check out our Upgrade Guide.
Share your dashboard with the world: Public dashboards are generally available
Generally available in all editions of Grafana
Public dashboards allow you to share your visualizations and insights with a broader audience without the requirement of a login. You can effortlessly use our current sharing model and create a public dashboard URL to share with anyone using the generated public URL link. To learn more, refer to the Public dashboards documentation, as well as the following video demo:
Navigate lengthy, mixed data in Explore with Content Outline
Generally available in all editions of Grafana
Introducing Content Outline in Grafana Explore. It’s easy to lose track of your place when you’re running complex mixed queries or switching between logs and traces. Content outline is our first step towards seamless navigation from log lines to traces and back to queries, ensuring quicker searches while preserving context. Experience efficient, contextual investigations with this update in Grafana Explore. To learn more, refer to the Content outline documentation, as well as the following video demo.
Correlations
Grafana Correlations is a new public preview feature you can use to establish links from any data source query to any other, carrying forward data like namespace, host, or label values. This is extremely powerful for performing root cause analysis with a diverse set of data sources. For more information, refer to the documentation.
Create Correlations the easy way in Grafana Explore
Available in public preview in all editions of Grafana
Creating correlations has just become easier. Try out our new correlations editor in Explore by selecting the + Add > Add correlation option from the top bar or from the command palette. The editor shows all possible places where you can place data links and guides you through building and testing target queries. For more information, refer to the documentation.
To try out Correlations, enable the correlations
feature toggle.

Create correlations for provisioned data sources
Available in public preview in all editions of Grafana
In previous versions of Grafana, if a data source was provisioned, the only way to add correlations to it was also with provisioning. Now, that’s no longer the case, and you can easily create new correlations mixing both methods—using the Administration page or provisioning. For more information, refer to the documentation.
To try out Correlations, enable the correlations
feature toggle.
Dashboards and visualizations
Use AI to generate titles, descriptions, and change summaries
Available in public preview in all editions of Grafana
You can now use generative AI to assist you in your Grafana dashboards. So far generative AI can help you with the following tasks:
- Generate panel and dashboard titles and descriptions - You can now generate a title and description for your panel or dashboard based on the data you’ve added to it. This is useful when you want to quickly visualize your data and don’t want to spend time coming up with a title or description.
- Generate dashboard save changes summary - You can now generate a summary of the changes you’ve made to a dashboard when you save it. This is great for effortlessly tracking the history of a dashboard.
To enable these features, you must first enable the dashgpt
feature toggle. Then install and configure Grafana’s LLM app plugin. For more information, refer to the Grafana LLM app plugin documentation.
When enabled, look for the ✨ Auto generate option next to the Title and Description fields in your panels and dashboards, or when you press the Save button.
Find your dashboard faster with the new Dashboards browse screen
Generally available in all editions of Grafana
The new browse screen for dashboards features a more compact design, making it easier to navigate, search for, and manage your folders and dashboards. The new interface also has many performance improvements, especially for instances with a large number of folders and dashboards.
To make using folders easier and more consistent, there’s no longer a special General folder. Dashboards without a folder, or dashboards previously in the General folder, are now shown at the root level.
To try it out, go to the Dashboards section of your Grafana instance.
Create interactive buttons in canvas visualizations
Available in public preview in all editions of Grafana
You can now add buttons to your canvas visualizations. Buttons can be configured to call an API endpoint. This pushes Grafana’s capabilities to new heights, allowing you to create interactive dashboards that can be used to control external systems.
To learn more, refer to our Canvas button element documentation, as well as the following video demo.
Zoom in on the y-axis of the time series and candlestick visualizations
Generally available in all editions of Grafana
You can now zoom in on the y-axis of your time series and candlestick visualizations. This is useful when you want to focus on a specific range of values. To zoom in on the y-axis on supported visualizations, hold the Shift key while clicking and dragging; double-click to reset the zoom.
Calculate visualization min/max individually per field
Generally available in all editions of Grafana
When visualizing multiple fields with a wide spread of values, calculating the min or max value of the visualization based on all fields can hide useful details.

In this example in the stat visualization, it’s hard to get an idea of how the values of each series relate to the historical values of that series. The threshold of 10% is exceeded by the A-series even though the A-series is below 10% of its historical maximum.
Now, you can automatically calculate the min or max of each visualized field based on the lowest and highest value of the individual field. This setting is available in the standard options of most visualizations.

In this example, using the same data, with the min and max calculated for each individual field, we get a much better understanding of how the current value relates to the historical values. The A-series no longer exceeds the 10% threshold; in fact, it’s now clear that it’s at a historical low.
This isn’t only useful in the stat visualization—gauge, bar gauge, and status history visualizations, table cells formatted by thresholds, and gauge table cells all benefit from this addition.
Data visualization quality of life improvements
Generally available in all editions of Grafana
We’ve made a number of smaller improvements to the data visualization experience in Grafana.
Geomap marker symbol alignment options
You can now offset geomap marker symbols from the underlying data point.

Gauge visualization overflow support
You can now visualize gauges in vertical and horizontal orientations with overflow. This resolves an issue where the design would break when the number of gauges exceeded the available space.

Bar chart axes improvements
You can now center bar chart axes on zero and configure axes border and color settings.

Data sources and querying
Tempo data source
We’ve placed special focus on the Tempo data source over the past couple of months with new features, query performance improvements, and a better query experience.
Compute RED metrics over spans aggregated by attribute with the “Aggregate By” Search option
Experimental in all editions of Grafana
Requires Tempo or Grafana Enterprise Traces (GET) v2.2 or greater.
We’ve added an Aggregate By option to the
TraceQL query editor to leverage Tempo’s
metrics summary API. You can calculate RED metrics (total span count, percent erroring spans, and latency information) for spans of kind=server received in the last hour that match your filter criteria, grouped by whatever attributes you specify.
This feature is disabled by default. To enable it, use the metricsSummary
experimental feature toggle.
For more information, refer to the documentation, as well as the following video demo.
Query traces more easily with the Improved TraceQL editor
Generally available in all editions of Grafana
The TraceQL query editor has been improved to facilitate the creation of TraceQL queries. In particular, it now features improved autocompletion, syntax highlighting, and error reporting.
Group multiple spansets per trace
Generally available in all editions of Grafana
The
TraceQL query editor has been improved to facilitate the grouping of multiple spans per trace in TraceQL queries. For example, when by(resource.service.name) is added to your TraceQL query, it will group the spans in each trace by resource.service.name.
Create query-type template variables for the Tempo data source
Generally available in all editions of Grafana
The Tempo data source now supports query-type template variables. With this update, you can create variables for which the values are a list of attribute names or attribute values seen on spans received by Tempo.
To learn more, refer to the following video demo, as well as the Grafana Variables documentation.
SAP HANA®: Configure your data source with tenant database instance name and number
Generally available in Grafana Enterprise and Grafana Cloud
The SAP HANA® data source now supports tenant database connections by using the database name and/or instance number. This is helpful because these are less likely to change than the port for your database. For more information, refer to our SAP HANA® configuration documentation.
Datadog: Aggregate logs to compute metrics and time series
Generally available in Grafana Enterprise and Grafana Cloud
The Datadog data source now supports log aggregation. This feature helps aggregate logs/events into buckets and compute metrics and time series. For more information, refer to Datadog log aggregation.
Datadog: Rate-limit requests from the Datadog data source
Generally available in Grafana Enterprise and Grafana Cloud
In the Datadog data source, you can now block API requests for metric queries based on upstream rate limits. With this update, you can set a rate limit percentage at which the plugin stops sending queries.
To learn more, refer to Datadog data source settings, as well as the following video demo.
Microsoft SQL Server: Support for Azure Authentication (Service principal/MSI)
Generally available in all editions of Grafana
We’ve added support for Azure Authentication (Service principal/MSI) on our MS SQL plugin to authenticate and allow querying of content stored in SQL Managed Instance databases.
Enable this feature by setting the managed_identity_enabled property to true under the Azure heading in your configuration file (/conf/<your_config_file>.ini). Then take the following steps in your Microsoft SQL Server data source configuration UI:
- Under Authentication, select Azure AD Authentication in the drop-down to reveal the Azure Authentication Settings section.
- In this section, select either Managed Identity or App Registration.
- Enter the credentials accordingly.

Learn more in the Microsoft SQL Server documentation.
Transformations
As our work on improving the user experience of transforming data continues, we’ve also been adding new capabilities to transformations.
Use dashboard variables in transformations
Experimental in all editions of Grafana
Previously, the only transformation that supported dashboard variables was the Add field from calculation transformation. We’ve now extended the support for variables to the Filter by value, Create heatmap, Histogram, Sort by, Limit, Filter by name, and Join by field transformations.
We’ve also made it easier to find the correct dashboard variable by displaying available variables in the fields that support them, either in the drop-down or as a suggestion when you type $ or press Ctrl + Space.
New modes for the Add field from calculation transformation
Generally available in all editions of Grafana
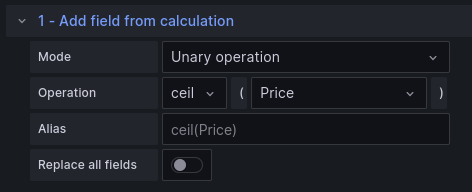
The Add field from calculation transformation has been updated.
Unary operation is a new mode that lets you apply mathematical operations to a field. The currently supported operations are:
- Absolute value (abs) - Returns the absolute value of a given expression. It represents its distance from zero as a positive number.
- Natural exponential (exp) - Returns e raised to the power of a given expression.
- Natural logarithm (ln) - Returns the natural logarithm of a given expression.
- Floor (floor) - Returns the largest integer less than or equal to a given expression.
- Ceiling (ceil) - Returns the smallest integer greater than or equal to a given expression.
Also, Row index can now show the index as a percentage.
Learn more in the Add field from calculation documentation.
Format strings with transformations
Experimental in all editions of Grafana
With the new Format string transformation, you can manipulate string fields to improve how they’re displayed. The currently supported operations are:
- Change case changes the case of your string to upper case, lower case, sentence case, title case, pascal case, camel case, or snake case.
- Trim removes white space characters at the start and end of your string.
- Substring selects a part of your string field.
Learn more in the Format string documentation.
See which transformations will work with your data
Available in public preview in all editions of Grafana
We’ve added initial support to detect situations in which various transformations won’t work appropriately based on current data. Previously, selecting the appropriate transformation and configuring it correctly required a process of trial and error or already knowing how a given transformation worked. Now, transformations that we’ve detected can’t be used are shaded in the interface to indicate this, along with a helpful message explaining why.

If you have the transformationsRedesign feature flag set, you’ll be able to access this functionality right away. If you’d like to try it, enable this feature flag in your
Grafana configuration.
Choose your timezome in the Format time and Convert field type transformations
Generally available in all editions of Grafana
We’ve added support for setting timezones manually when formatting times as strings using the Format time and Convert field type transformations. This allows times to be formatted relative to any timezone across the globe.

Alerting
Grafana OnCall integration for Alerting
Generally available in all editions of Grafana
Use the Grafana Alerting - Grafana OnCall integration to effortlessly connect alerts generated by Grafana Alerting with Grafana OnCall. From there, you can route them according to defined escalation chains and schedules.
To learn more, refer to the Grafana OnCall integration for Alerting documentation, as well as the following video demo.
Export alerting resources to Terraform
Generally available in all editions of Grafana
Export your alerting resources, such as alert rules, contact points, and notification policies as Terraform resources. A new “Modify export” mode for alert rules enables you to edit provisioned alert rules and export a modified version.
Additional contact points for external Alertmanager
Generally available in Grafana Open Source and Enterprise
We’ve added support for the Microsoft Teams contact points when using an external Alertmanager.
Authentication and authorization
No basic role
Generally available in Grafana Enterprise and Grafana Cloud
We’re excited to introduce the “No basic role,” a new basic role with no permissions. A basic role in Grafana dictates the set of actions a user or entity can perform, known as permissions. This new role is especially beneficial if you’re aiming for tailored, customized RBAC permissions for your service accounts or users. You can set this as a basic role through the API or UI.
Previously, permissions were granted based on predefined sets of capabilities. Now, with the “No basic role,” you have the flexibility to be even more granular.
For more details on basic roles and permissions, refer to the documentation.
New service account permissions
Service accounts allow you to create tokens to access Grafana’s API and dashboards. Service accounts are a powerful tool for authenticating with Grafana’s API and accessing data sources. However, without proper access controls, service accounts can pose a security risk to your Grafana instance. In Grafana 10.2, we’ve added new tools to limit service accounts to just the resources they need to access.
Add dashboard and folder permissions to service accounts
Generally available in all editions of Grafana
In this release, we’ve added the ability to assign dashboard and folder permissions to service accounts. This means that you can now create a service account that can be used to access a specific dashboard and nothing else.
This is useful if you want to limit the access service accounts have to your Grafana instance.
Learn more in our dashboard and folder permissions documentation.
Add data source permissions to service accounts
Generally available in Grafana Cloud and Grafana Enterprise
Grafana 10.2 also introduces the ability to assign data source permissions to service accounts, for Grafana CLoud and Enterprise users. With this feature, you can create a service account that has access to a specific data source and nothing else. This is useful in scenarios where you want to limit the access service accounts have to your Grafana instance.
For example, imagine you have a team of developers who need to access a specific data source to develop a new feature. Instead of giving them full access to your Grafana instance, you can create a service account that has access only to that data source. This way, you can limit the potential damage that could be caused by a compromised service account.
Learn more in our data source permissions documentation.

Role mapping support for Google OIDC
Generally available in all editions of Grafana
You can now map Google groups to Grafana organizational roles when using Google OIDC. This is useful if you want to limit the access users have to your Grafana instance.
We’ve also added support for controlling allowed groups when using Google OIDC.
Refer to the Google Authentication documentation to learn how to use these new options.
Configure refresh token handling separately for OAuth providers
Available in public preview in all editions of Grafana
With Grafana v9.3, we introduced a
feature toggle called accessTokenExpirationCheck. It improves the security of Grafana by checking the expiration of the access token and automatically refreshing the expired access token when a user is logged in using one of the OAuth providers.
With the current release, we’ve introduced a new configuration option for each OAuth provider called use_refresh_token that allows you to configure whether the particular OAuth integration should use refresh tokens to automatically refresh access tokens when they expire. In addition, to further improve security and provide secure defaults, use_refresh_token is enabled by default for providers that support either refreshing tokens automatically or client-controlled fetching of refresh tokens. It’s enabled by default for the following OAuth providers: AzureAD, GitLab, Google.
For more information on how to set up refresh token handling, please refer to the documentation of the particular OAuth provider..
Note
The
use_refresh_tokenconfiguration must be used in conjunction with theaccessTokenExpirationCheckfeature toggle. If you disable theaccessTokenExpirationCheckfeature toggle, Grafana won’t check the expiration of the access token and won’t automatically refresh the expired access token, even if theuse_refresh_tokenconfiguration is set totrue.The
accessTokenExpirationCheckfeature toggle will be removed in Grafana v10.3.
Permission validation on custom role creation and update
Generally available in Grafana Enterprise and Grafana Cloud
With the current release, we enabled RBAC permission validation (rbac.permission_validation_enabled setting) by default. This means that the permissions provided in the request during custom role creation or update are validated against the list of
available permissions and their scopes. If the request contains a permission that is not available or the scope of the permission is not valid, the request is rejected with an error message.
Recorded queries: Record multiple metrics from a single query
Generally available in Grafana Enterprise and Grafana Cloud
Recorded queries provide a way to take a static number, (for example, the number of GitHub issues open at a given time, or the number of rows in a database table) and record it periodically as a Prometheus metric. This is great for tracking numbers over time for quick querying later. Previously, recorded queries were limited to a single series, so you needed to narrow your query down to a single number in order to record it. Now, you can record multiple metrics with a single recorded query, which makes them more powerful and easier to create and manage.


