This is documentation for the next version of Grafana documentation. For the latest stable release, go to the latest version.
Flame graph
Flame graphs let you visualize profiling data. Using this visualization, a profile can be represented as a flame graph, top table, or both.
For example, if you want to understand which parts of a program consume the most resources, such as CPU time, memory, or I/O operations, you can use a flame graph to visualize and analyze where potential performance issues are:
You can use a flame graph visualization if you need to:
- Identify any performance hotspots to find where code optimizations may be needed.
- Diagnose the root cause of any performance degradation.
- Analyze the behavior of complex systems, including distributed systems or microservices architectures.
To learn more about how Grafana Pyroscope visualizes flame graphs, refer to Flame graphs: Visualizing performance data.
Configure a flame graph visualization
Once you’ve created a dashboard, the following video shows you how to configure a flame graph visualization:
With Grafana Play, you can explore and see how it works, learning from practical examples to accelerate your development. This feature can be seen on Flame Graphs.
Supported data formats
To render a flame graph, you must format the data frame data using a nested set model.
A nested set model ensures each item of a flame graph is encoded by its nesting level as an integer value, its metadata, and by its order in the data frame. This means that the order of items is significant and needs to be correct. The ordering is a depth-first traversal of the items in the flame graph which recreates the graph without needing variable-length values in the data frame like in a children’s array.
Required fields:
Diff profiles can also include optional valueRight and selfRight fields. When present, the tooltip and top table show baseline, comparison, and diff values.
Example
The following table is an example of the type of data you need for a flame graph visualization and how it should be formatted:
Flame graph mode
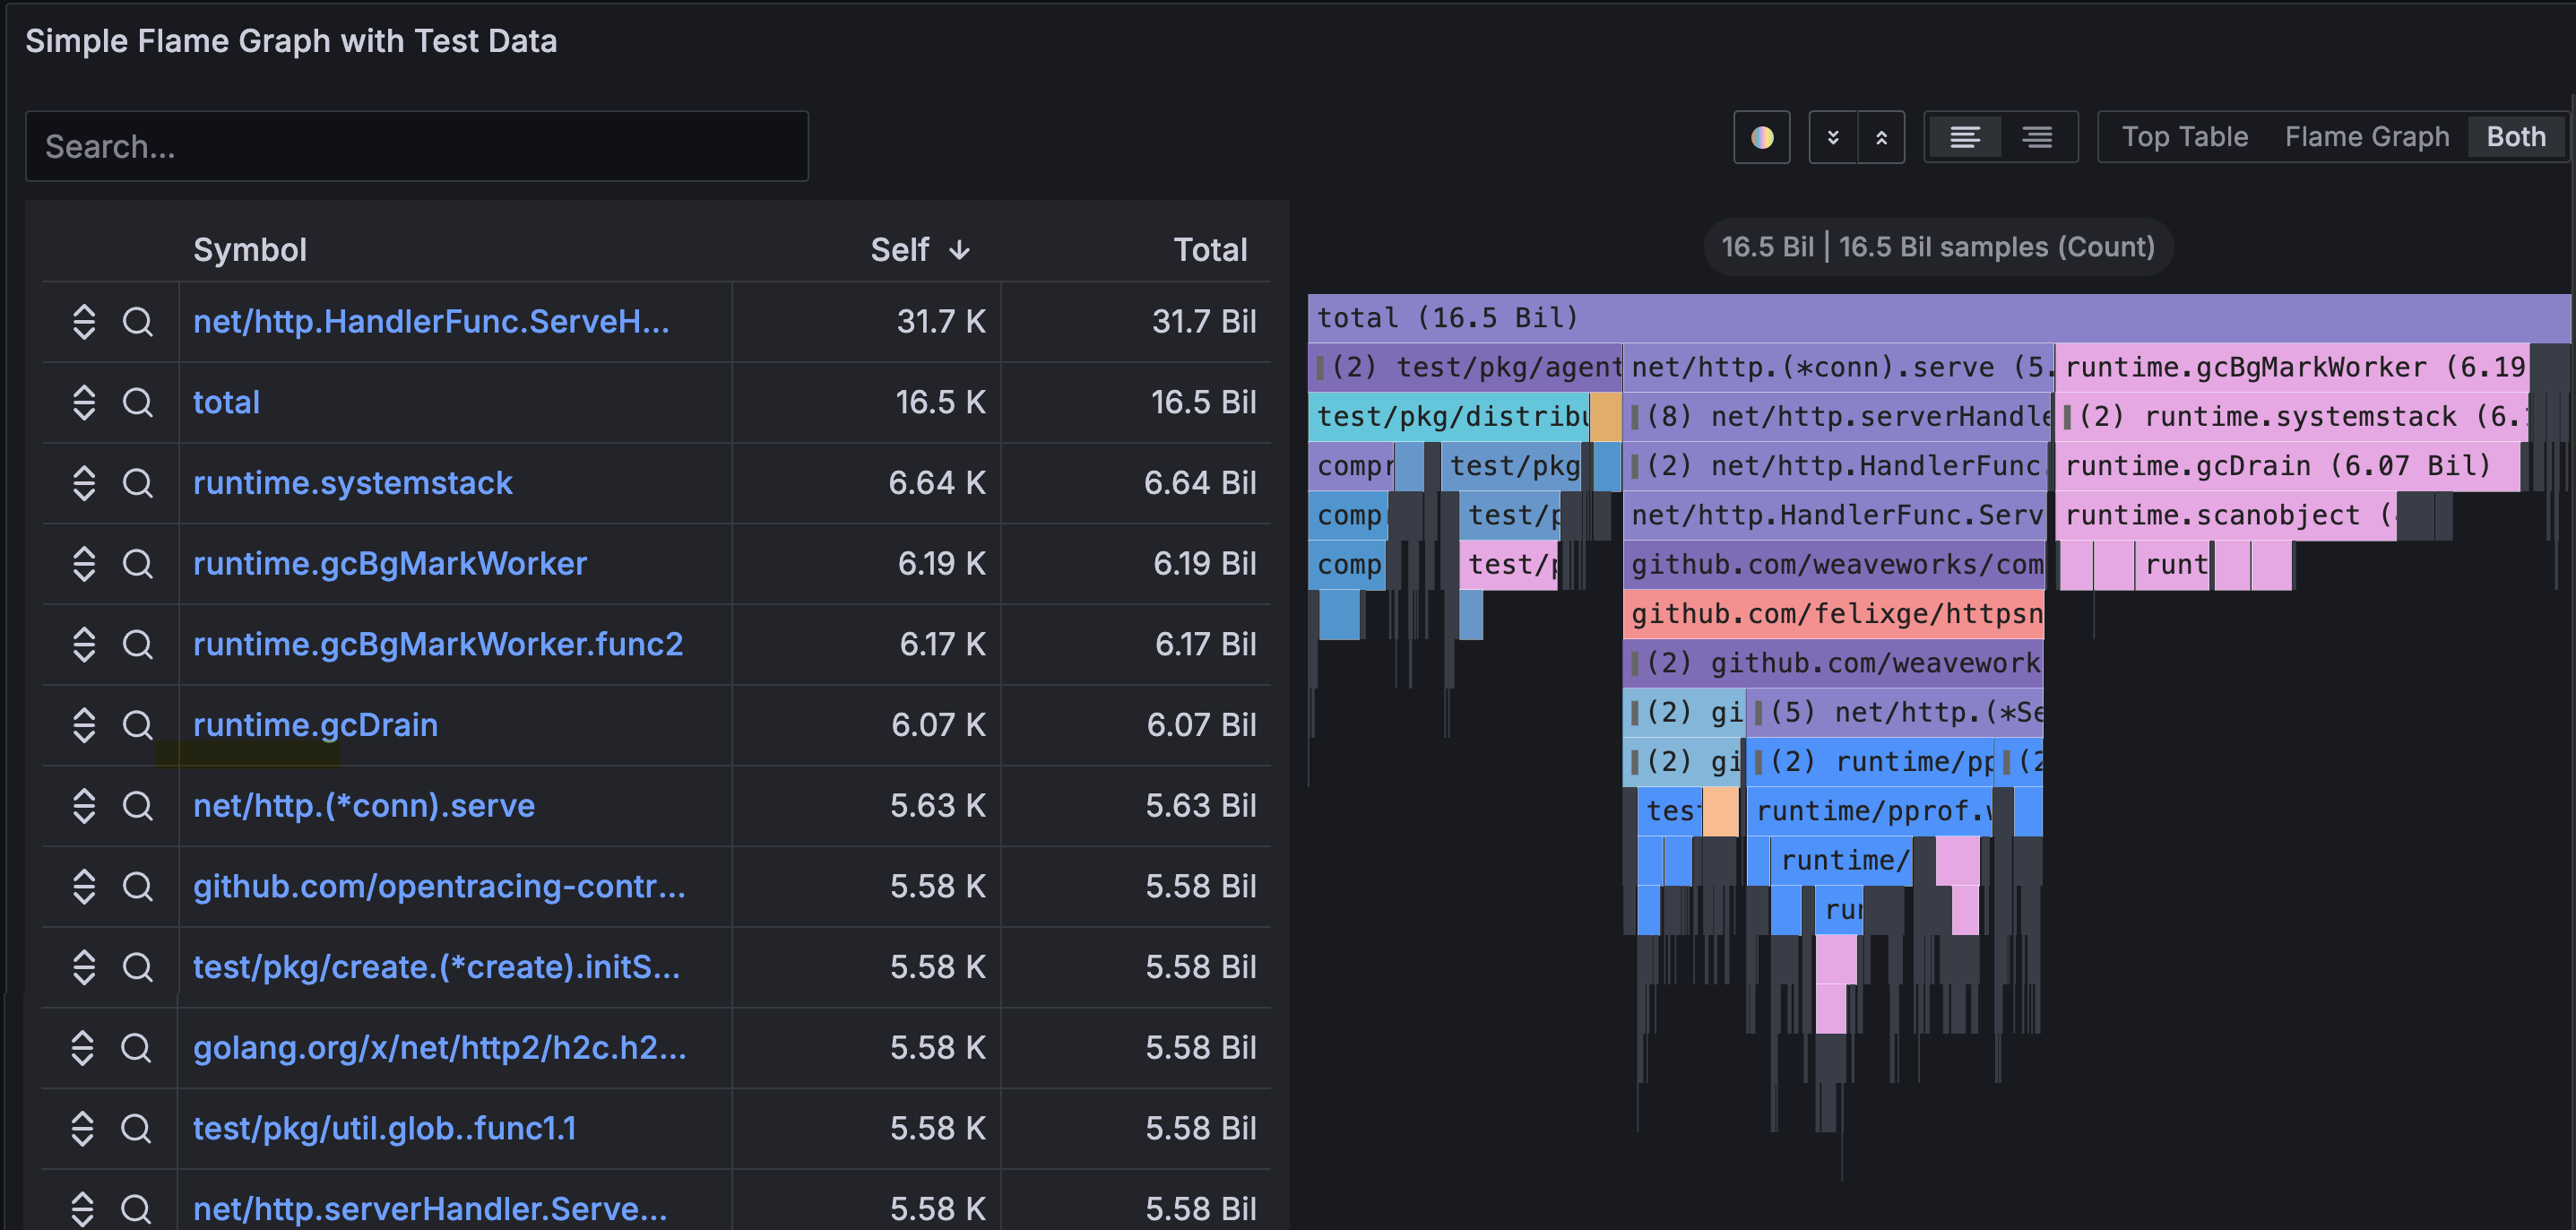
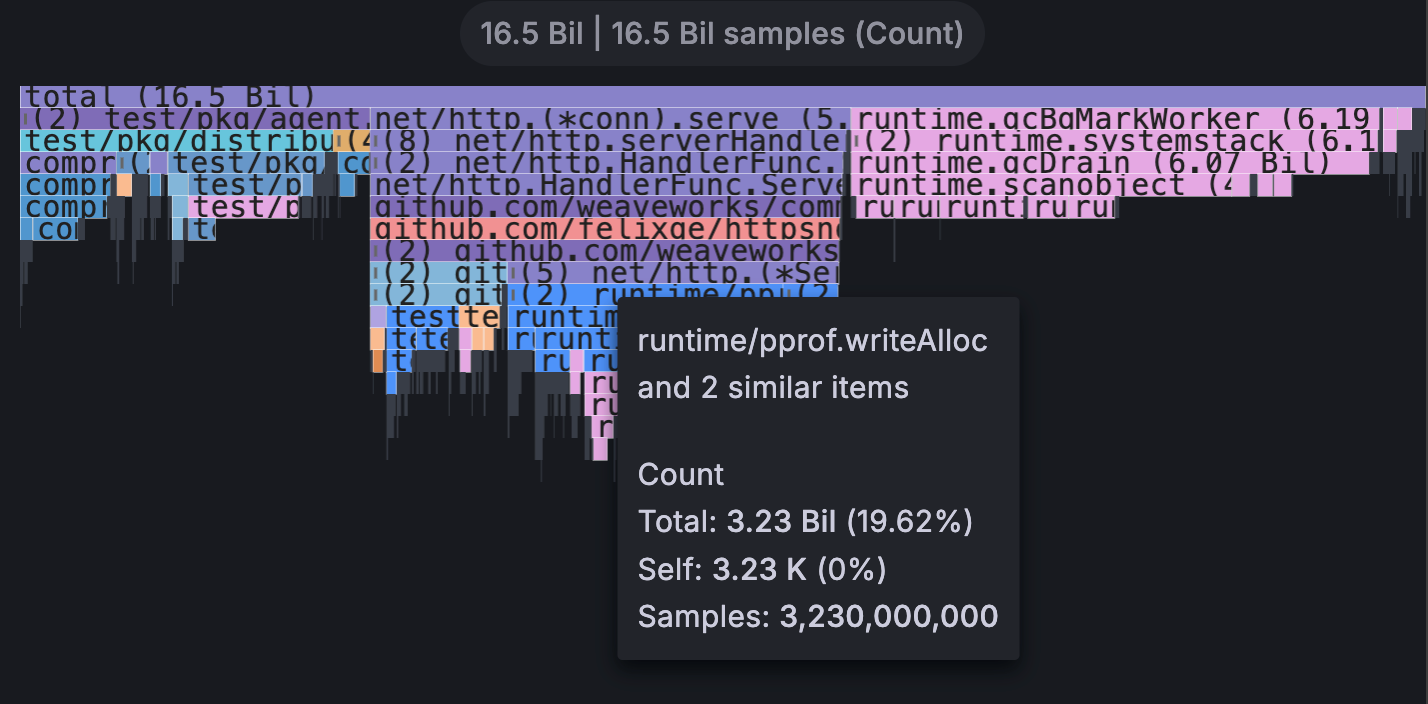
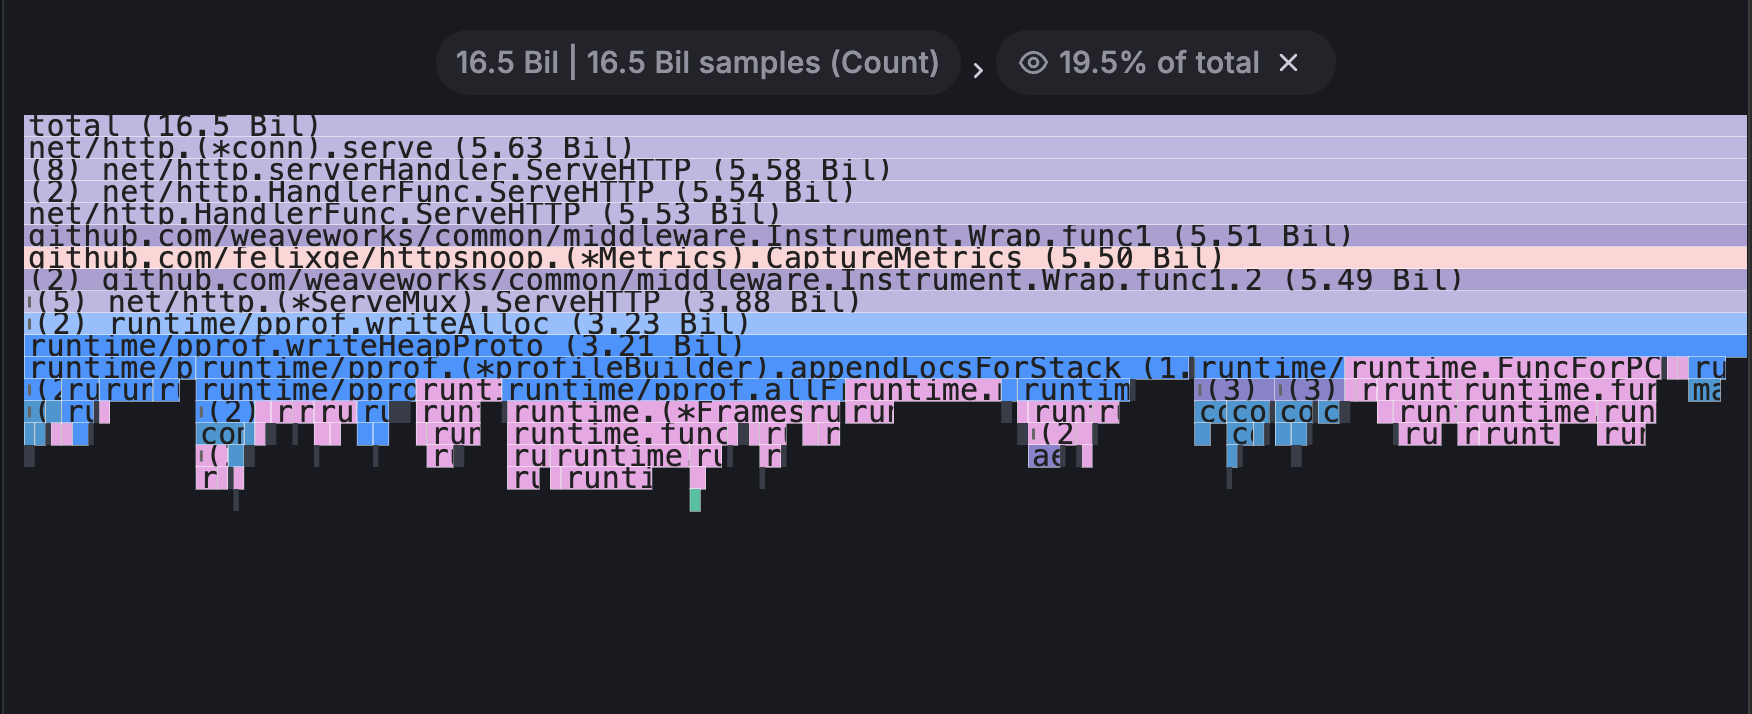
A flame graph takes advantage of the hierarchical nature of profiling data. It condenses data into a format that allows you to easily see which code paths are consuming the most system resources, such as CPU time, allocated objects, or space when measuring memory. Each block in the flame graph represents a function call in a stack and its width represents its value.
Grayed-out sections are a set of functions that represent a relatively small value and they are collapsed together into one section for performance reasons.
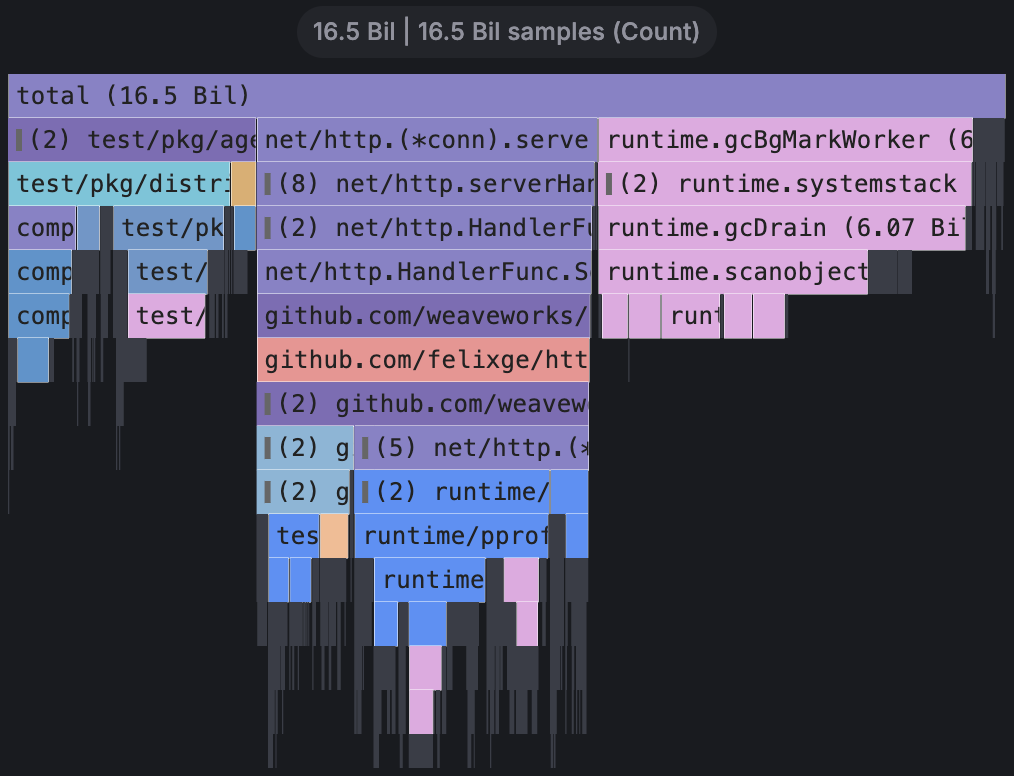
You can hover over a specific function to view a tooltip that shows you additional data about that function, like the function’s value, percentage of total value, and the number of samples with that function.
Menu actions
You can click a function to show a drop-down menu with additional actions:
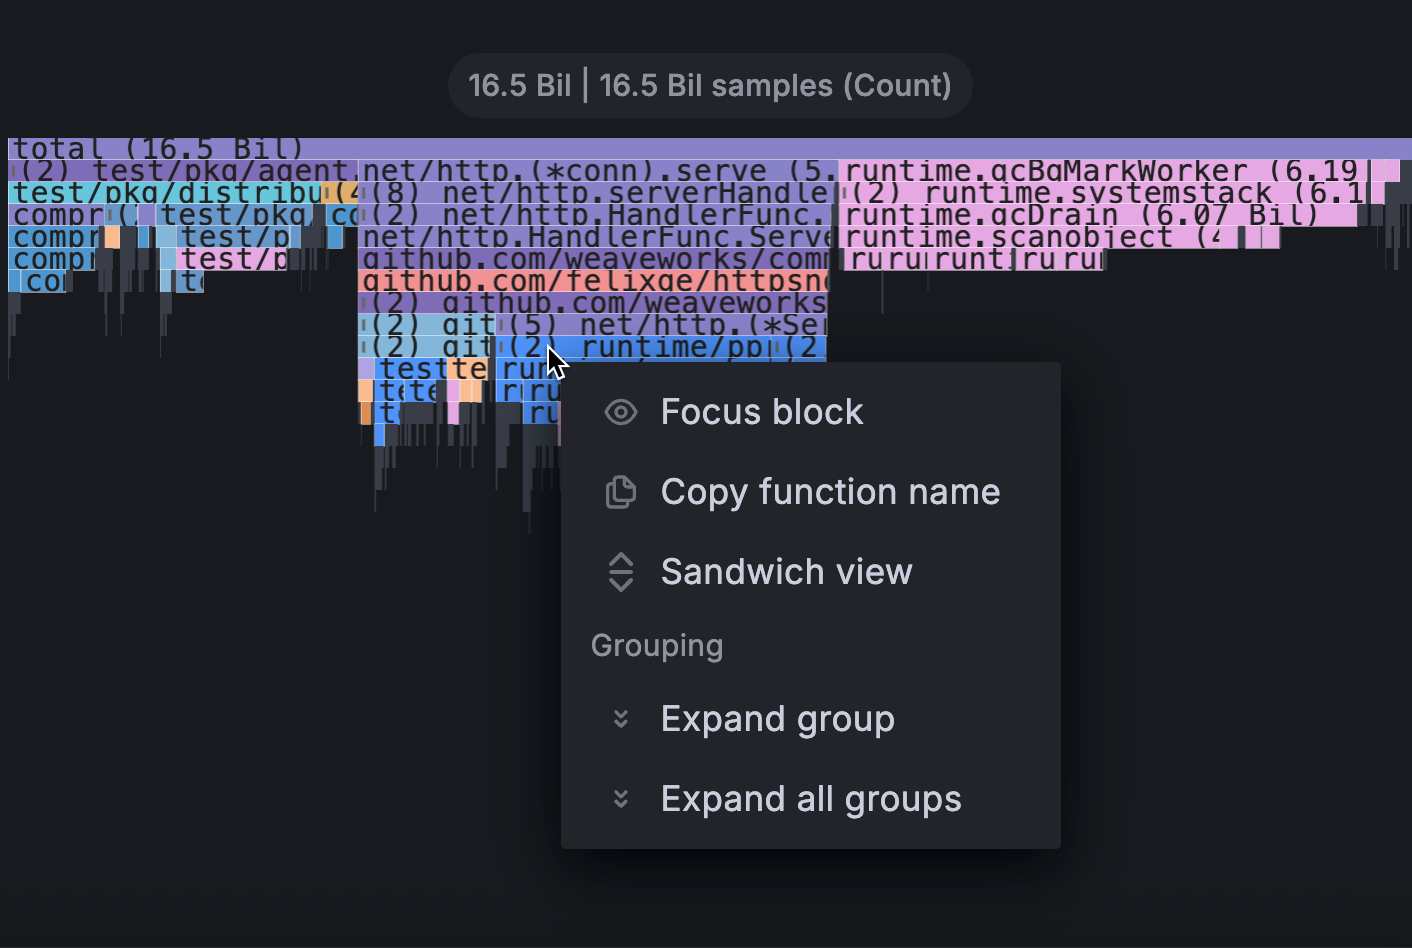
Focus block
When you click Focus block, the block, or function, is set to 100% of the flame graph’s width and all its child functions are shown with their widths updated relative to the width of the parent function. This makes it easier to drill down into smaller parts of the flame graph.
Copy function name
When you click Copy function name, the full name of the function that the block represents is copied.
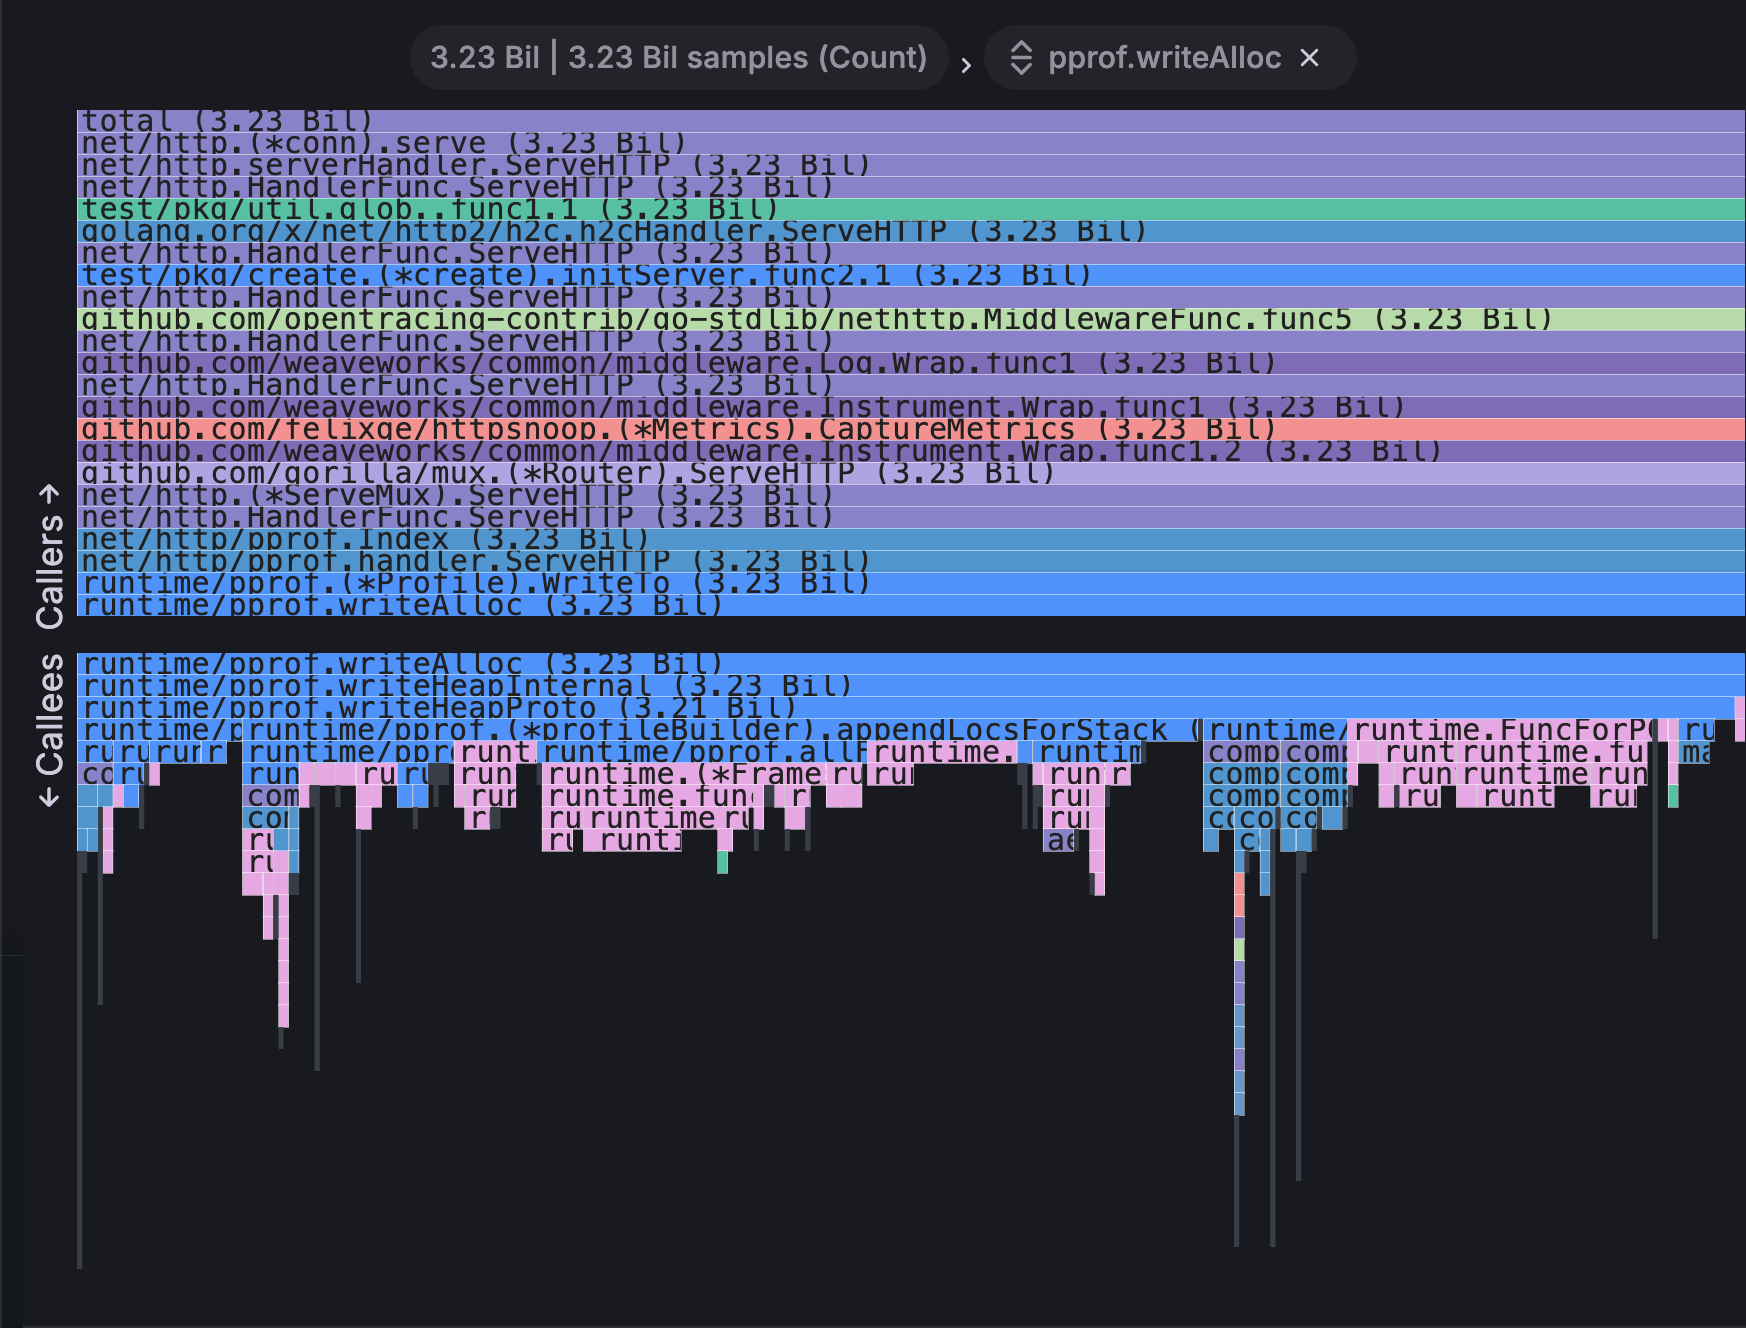
Sandwich view
The sandwich view allows you to show the context of the clicked function. It shows all the function’s callers on the top and all the callees at the bottom. This shows the aggregated context of the function so if the function exists in multiple places in the flame graph, all the contexts are shown and aggregated in the sandwich view.
Grouping
Under the Grouping section of the menu, the following options let you expand and collapse groups of functions:
- Expand group - Expands the grouped function you’ve clicked. Displayed if you click a function that’s been automatically grouped in the flame graph.
- Expand all groups - Expands all grouped functions in the flame graph. Always displayed when you click the graph.
- Collapse group - Collapses the expanded function you’ve clicked. Displayed if you click a function in the flame graph that’s been manually expanded.
- Collapse all groups - Collapses all expanded functions in the flame graph. Displayed if there are any expanded functions when you click the graph.
Status bar
The status bar shows metadata about the flame graph and currently applied modifications, like what part of the graph is in focus or what function is shown in sandwich view. Click the X in the status bar pill to remove that modification.

Top table mode
The top table shows the functions from the profile in table format. The table has three columns: Symbol, Self, and Total. The table is sorted by self time by default, but can be reordered by total time or symbol name by clicking the column headers. Each row represents aggregated values for the given function if the function appears in multiple places in the profile.
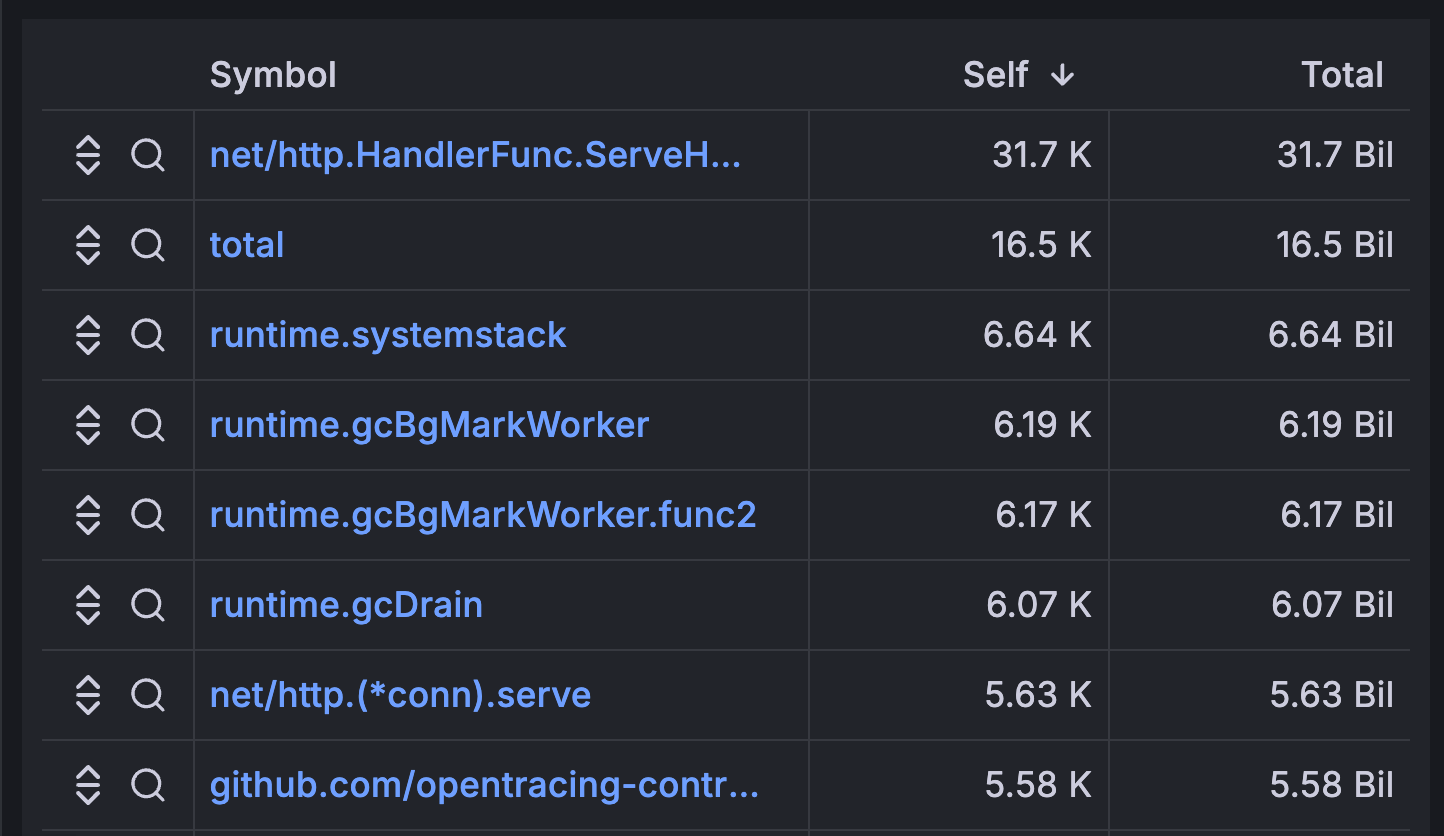
There are also action buttons on the left-most side of each row. The first button searches for the function name while second button shows the sandwich view of the function.
Toolbar
The following table lists the features of the toolbar:
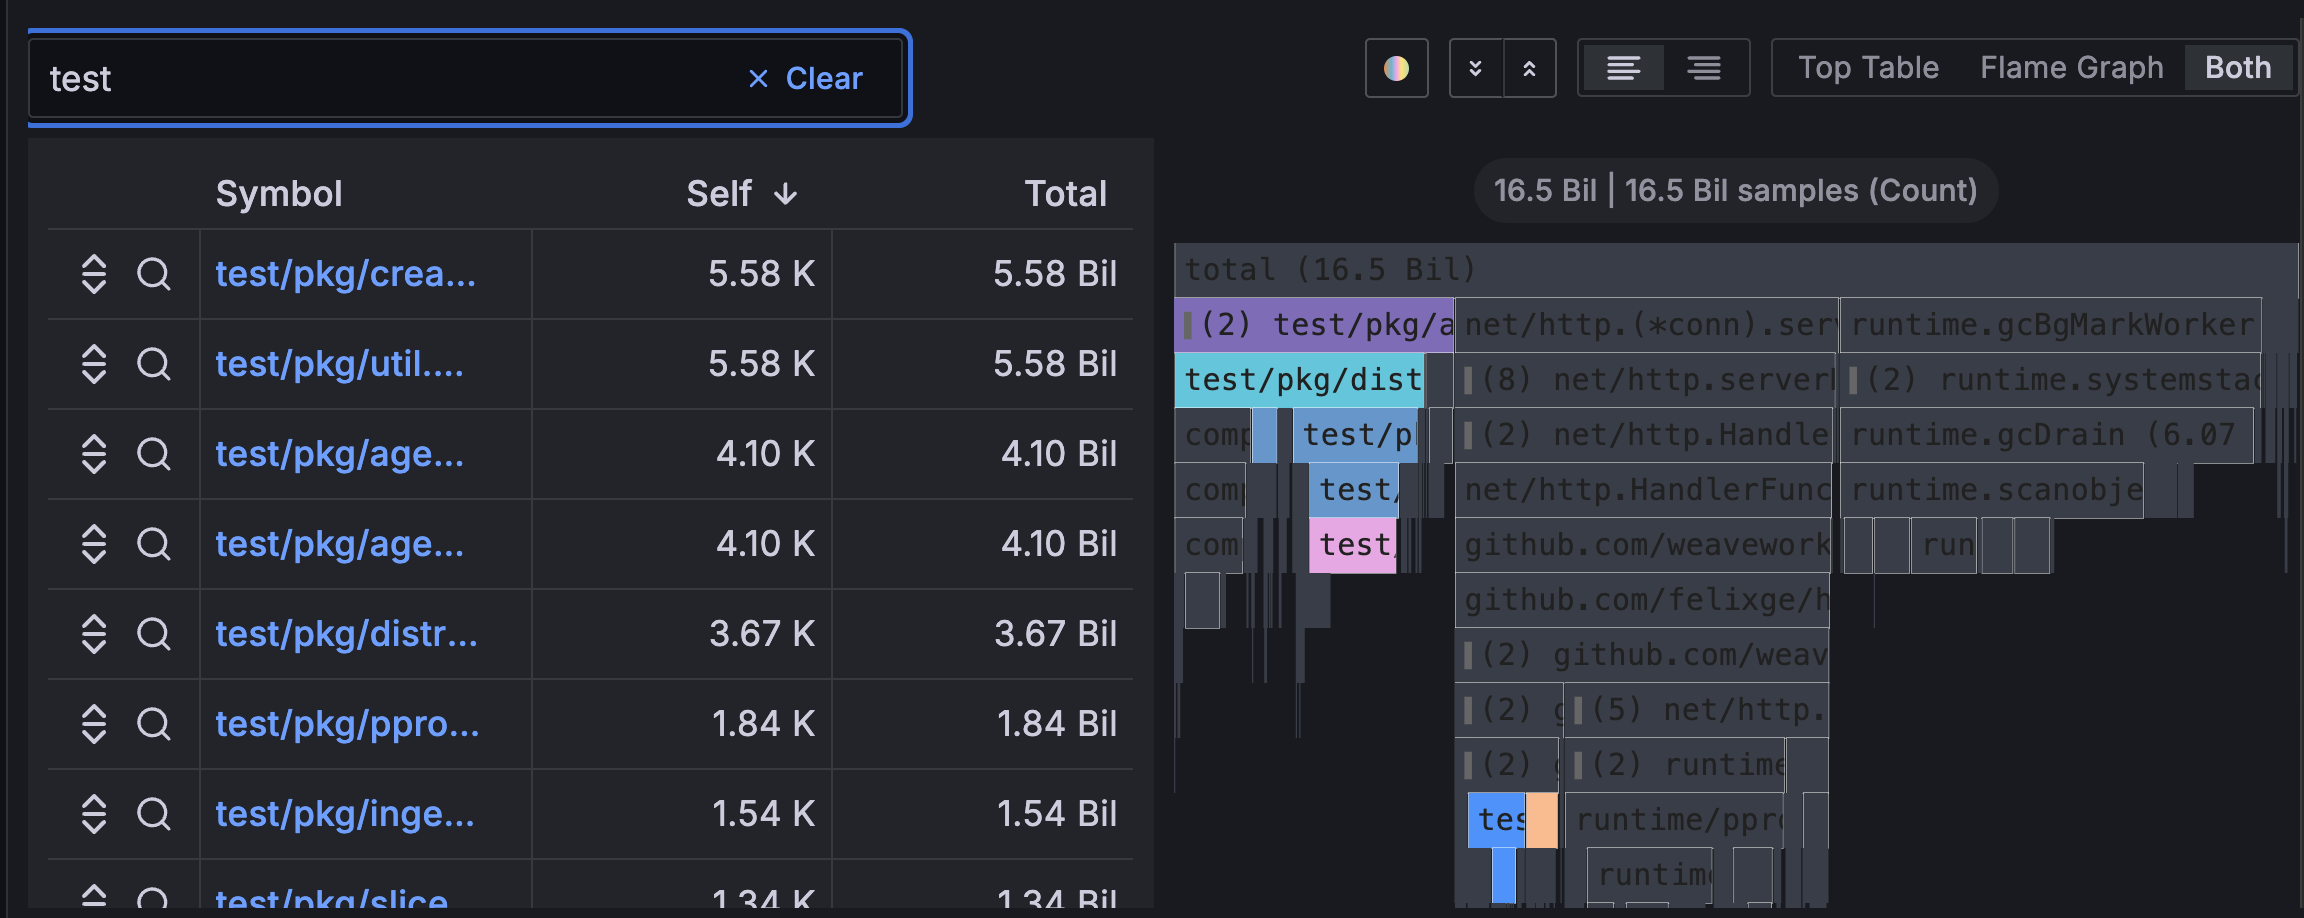
Search
You can use the search field to find functions with a particular name. All the functions in the flame graph that match the search will remain colored while the rest of the functions are grayed-out.
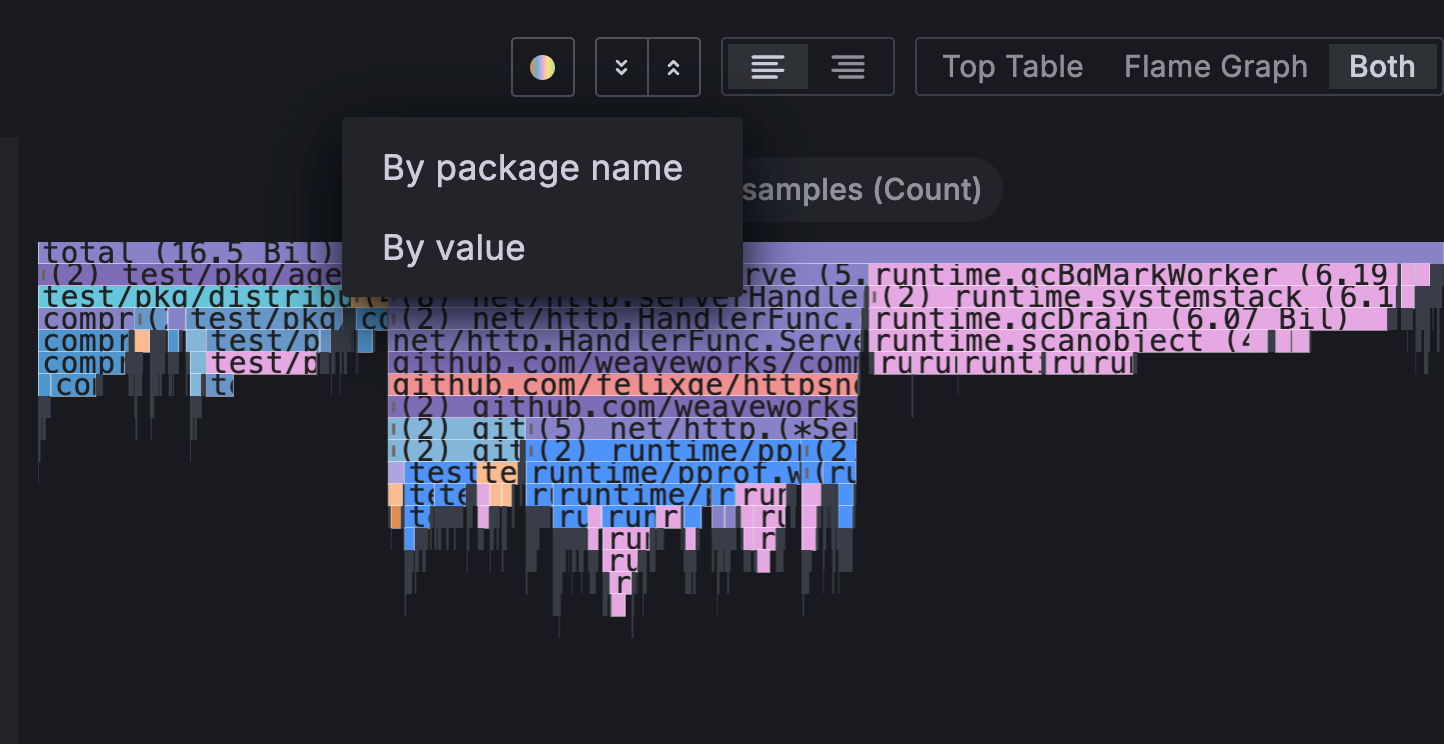
Change color scheme
You can switch between By value and By package name to visually tie functions from the same package together.
Configuration options
The following section describes the configuration options available in the panel editor pane for this visualization. These options are, as much as possible, ordered as they appear in Grafana.
Panel options
In the Panel options section of the panel editor pane, set basic options like panel title and description, as well as panel links. To learn more, refer to Configure panel options.
Standard options
Standard options in the panel editor pane let you change how field data is displayed in your visualizations. When you set a standard option, the change is applied to all fields or series. For more granular control over the display of fields, refer to Configure field overrides.
You can customize the following standard options:
Field overrides
Overrides allow you to customize visualization settings for specific fields or series. When you add an override rule, it targets a particular set of fields and lets you define multiple options for how that field is displayed.
Choose from the following override options:
To learn more, refer to Configure field overrides.


