This is documentation for the next version of Grafana documentation. For the latest stable release, go to the latest version.
Manage dashboard links
You can use links to navigate between commonly-used dashboards or to connect others to your visualizations. Links let you create shortcuts to other dashboards, panels, and even external websites.
Grafana supports dashboard links, panel links, and data links. Dashboard links are displayed at the top of the dashboard. Panel links are accessible by clicking the icon next to the panel title.
Which link should you use?
Start by figuring out how you’re currently navigating between dashboards. If you’re often jumping between a set of dashboards and struggling to find the same context in each, links can help optimize your workflow.
The next step is to figure out which link type is right for your workflow. Even though all the link types in Grafana are used to create shortcuts to other dashboards or external websites, they work in different contexts.
- If the link relates to most if not all of the panels in the dashboard, use dashboard links.
- If you want to drill down into specific panels, use panel links.
- If you want to link to an external site, you can use either a dashboard link or a panel link.
- If you want to drill down into a specific series, or even a single measurement, use data links.
Controlling time range using the URL
To control the time range of a panel or dashboard, you can provide query parameters in the dashboard URL:
from- defines lower limit of the time range, specified in ms epochto- defines upper limit of the time range, specified in ms epochtimeandtime.window- defines a time range fromtime-time.window/2totime+time.window/2. Both params should be specified in ms. For example?time=1500000000000&time.window=10000will result in 10s time range from 1499999995000 to 1500000005000
Dashboard links
When you create a dashboard link, you can include the time range and current template variables to directly jump to the same context in another dashboard. This way, you don’t have to worry whether the person you send the link to is looking at the right data. For other types of links, refer to Data link variables.
Dashboard links can also be used as shortcuts to external systems, such as submitting a GitHub issue with the current dashboard name.
To see an example of dashboard links in action, check out:
Once you’ve added a dashboard link, it appears in the upper right corner of your dashboard.
Add links to dashboards
To add a link to another dashboard at the top of your current dashboard, follow these steps:
- In the dashboard you want to link, click Edit.
- In the toolbar, click the Dashboard options icon.
- In the sidebar, click Settings.
- Go to the Links tab and then click Add dashboard link.
In the With tags drop-down list, enter tags to limit the linked dashboards to only the ones with the tags you enter.
If you don’t add any tags, Grafana includes links to all other dashboards.
Set link options:
- Show as dropdown – If you are linking to lots of dashboards, then you probably want to select this option and add an optional title to the dropdown. Otherwise, Grafana displays the dashboard links side by side across the top of your dashboard.
- Include current time range – Select this option to include the dashboard time range in the link. When the user clicks the link, the linked dashboard opens with the indicated time range already set. Example: https://play.grafana.org/d/000000010/annotations?orgId=1&from=now-3h&to=now
- Include current template variable values – Select this option to include template variables currently used as query parameters in the link. When the user clicks the link, any matching templates in the linked dashboard are set to the values from the link. For more information, see Dashboard URL variables.
- Open link in new tab – Select this option if you want the dashboard link to open in a new tab or window.
- Show in controls menu – Select this option to display the link in the dashboard controls menu instead of at the top of the dashboard. The dashboard controls menu appears as a button in the dashboard toolbar.
- Click Save.
- (Optional) Enter a description of the changes you’ve made.
- Click Save.
- Click Back to dashboard and Exit edit.
The default link type is Dashboards.
Tip
To add links without leaving the dashboard, click the Add new element icon in the dashboard toolbar, and select Link. For more information, refer to the Dashboard controls documentation.
Add a URL link to a dashboard
Add a link to a URL at the top of your current dashboard. You can link to any available URL, including dashboards, panels, or external sites. You can even control the time range to ensure the user is zoomed in on the right data in Grafana.
To add a URL link to your dashboard, follow these steps:
- In the dashboard you want to link, click Edit.
- In the toolbar, click the Dashboard options icon.
- In the sidebar, click Settings.
- Go to the Links tab and then click Add dashboard link.
In the Type drop-down list, select Link.
In the URL field, enter the URL to which you want to link.
Depending on the target, you might want to include field values. Example: https://github.com/grafana/grafana/issues/new?title=Dashboard%3A%20HTTP%20Requests
In the Tooltip field, enter the tooltip you want the link to display when the user hovers their mouse over it.
In the Icon drop-down, choose the icon you want displayed with the link.
Set link options; by default, these options are enabled for URL links:
- Include current time range – Select this option to include the dashboard time range in the link. When the user clicks the link, the linked dashboard opens with the indicated time range already set. Example: https://play.grafana.org/d/000000010/annotations?orgId=1&from=now-3h&to=now
- Include current template variable values – Select this option to include template variables currently used as query parameters in the link. When the user clicks the link, any matching templates in the linked dashboard are set to the values from the link.
- Open link in new tab – Select this option if you want the dashboard link to open in a new tab or window.
- Show in controls menu – Select this option to display the link in the dashboard controls menu instead of at the top of the dashboard. The dashboard controls menu appears as a button in the dashboard header.
- Click Save in the top-right corner.
- Enter an optional description of your changes and click Save.
- Click Back to dashboard and then Exit edit.
Update a dashboard link
To edit, duplicate, or delete dashboard link, follow these steps:
In the dashboard you want to link, click Edit.
In the toolbar, click the Dashboard options icon.
In the sidebar, click Settings.
Go to the Links tab.
Do one of the following:
- Edit - Click the name of the link and update the link settings.
- Duplicate - Click the copy link icon next to the link that you want to duplicate.
- Delete - Click the red X next to the link that you want to delete, and then Delete.
Click Save in the top-right corner.
Enter an optional description of your changes and click Save.
Click Back to dashboard and then Exit edit.
Panel links
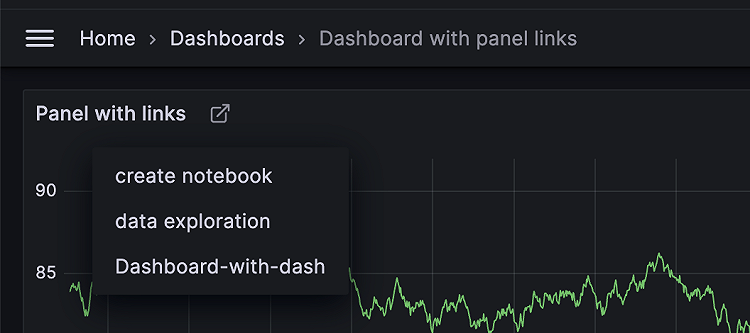
Each panel can have its own set of links that are shown in the upper left of the panel after the panel title. You can link to any available URL, including dashboards, panels, or external sites. You can even control the time range to ensure the user is zoomed in on the right data in Grafana.
Click the icon next to the panel title to see available panel links.
Add a panel link
Hover over any part of the panel to which you want to add the link to display the actions menu on the top right corner.
Click the menu and select Edit.
To use a keyboard shortcut to open the panel, hover over the panel and press
e.Expand the Panel options section, scroll down to Panel links.
Click Add link.
Enter a Title. Title is a human-readable label for the link that will be displayed in the UI.
Enter the URL you want to link to. You can even add one of the template variables defined in the dashboard. Press Ctrl+Space or Cmd+Space and click in the URL field to see the available variables. By adding template variables to your panel link, the link sends the user to the right context, with the relevant variables already set. You can also use time variables:
from- Defines the lower limit of the time range, specified in ms epoch.to- Defines the upper limit of the time range, specified in ms epoch.timeandtime.window- Define a time range fromtime-time.window/2totime+time.window/2. Both params should be specified in ms. For example?time=1500000000000&time.window=10000will result in 10s time range from 1499999995000 to 1500000005000.
If you want the link to open in a new tab, then select Open in new tab.
Click Save to save changes and close the dialog box.
Click Save in the top-right corner.
Enter an optional description of your changes and click Save.
Click Back to dashboard and then Exit edit.
Update a panel link
Hover over any part of the panel to display the actions menu on the top right corner.
Click the menu and select Edit.
To use a keyboard shortcut to open the panel, hover over the panel and press
e.Expand the Panel options section, scroll down to Panel links.
Find the link that you want to make changes to.
Click the Edit (pencil) icon to open the Edit link window.
Make any necessary changes.
Click Save to save changes and close the dialog box.
Click Save in the top-right corner.
Enter an optional description of your changes and click Save.
Click Back to dashboard and then Exit edit.
Delete a panel link
Hover over any part of the panel to display the actions menu on the top right corner.
Click the menu and select Edit.
To use a keyboard shortcut to open the panel, hover over the panel and press
e.Expand the Panel options section, scroll down to Panel links.
Find the link that you want to delete.
Click the X icon next to the link you want to delete.
Click Save in the top-right corner.
Enter an optional description of your changes and click Save.
Click Back to dashboard and then Exit edit.


