This is documentation for the next version of Grafana documentation. For the latest stable release, go to the latest version.
Build your first dashboard
This topic helps you get started with Grafana and build your first dashboard using the built-in Grafana data source. To learn more about Grafana, refer to
Introduction to Grafana.
Note
Grafana also offers a free account with Grafana Cloud to help getting started even easier and faster. You can install Grafana to self-host or get a free Grafana Cloud account.
Install Grafana
Grafana can be installed on many different operating systems. For a list of the minimum hardware and software requirements, as well as instructions on installing Grafana, refer to Install Grafana.
Sign in to Grafana
To sign in to Grafana for the first time:
Open your web browser and go to http://localhost:3000/.
The default HTTP port that Grafana listens to is
3000unless you have configured a different port.On the sign-in page, enter
adminfor both the username and password.Click Sign in.
If successful, you’ll see a prompt to change the password.
Click OK on the prompt and change your password.
Note
We strongly recommend that you change the default administrator password.
Create a dashboard
If you’ve already set up a data source that you know how to query, refer to Create a dashboard instead.
To create your first dashboard using the built-in -- Grafana -- data source:
Click Dashboards in the main menu.
On the Dashboards page, click New and select New dashboard from the drop-down menu.
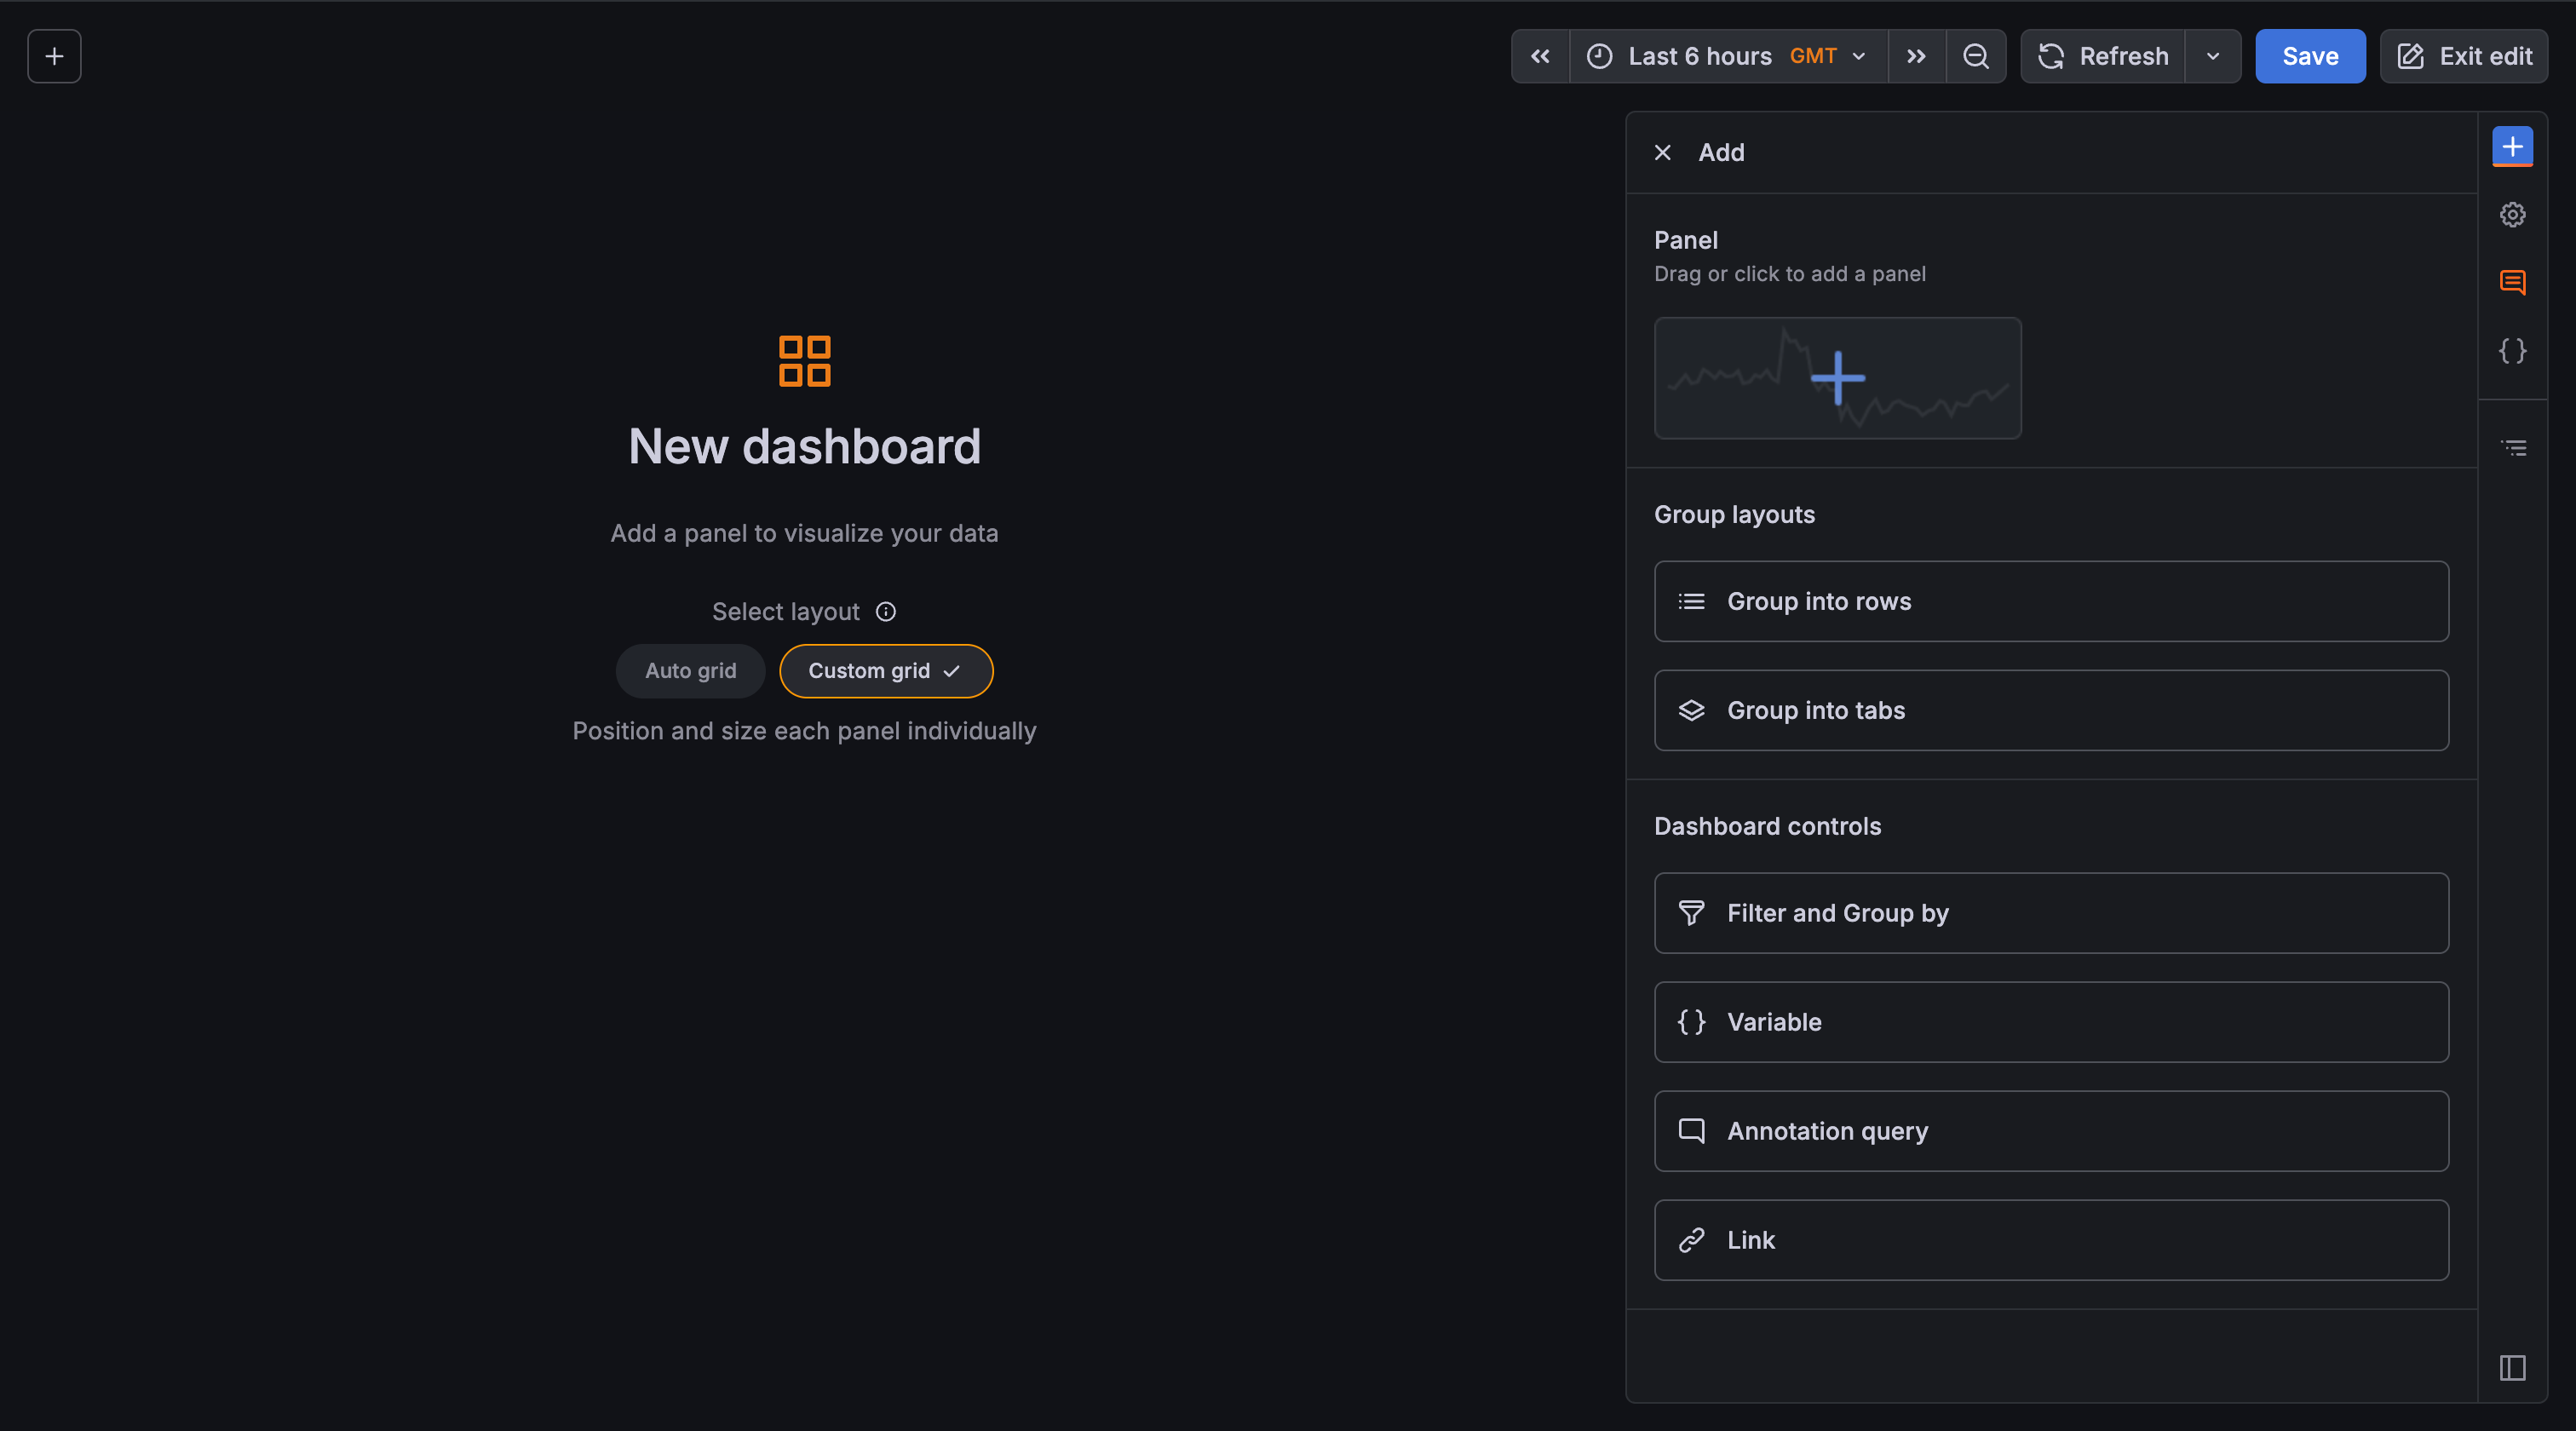
Click the Add new element icon.
Click or drag a panel onto the dashboard.
![New dashboard]()
On the panel, click Configure visualization.
The Edit panel view opens with the default data source for your instance preselected.
In the Queries tab, click the Data source drop-down list, enter
-- Grafana --, and select that data source.This configures your query and generates the Random Walk dashboard.
In the panel edit pane, select the Time series visualization.
Click Refresh to query the data source.
When you’ve finished editing your panel, click Save.
Alternatively, click Back to dashboard if you want to see your changes applied to the dashboard first. Then click Save when you’re ready.
Add a descriptive title for the dashboard, or have Grafana create one using generative AI features, and then click Save.
Click Back to dashboard and then Exit edit.
Congratulations, you have created your first dashboard and it’s displaying results.
Next steps
Continue to experiment with what you have built, try the explore workflow or another visualization feature. Refer to Data sources for a list of supported data sources and instructions on how to add a data source. The following topics will be of interest to you:
Admins
The following topics are of interest to Grafana server admin users:


