This is documentation for the next version of Grafana documentation. For the latest stable release, go to the latest version.
Span filters
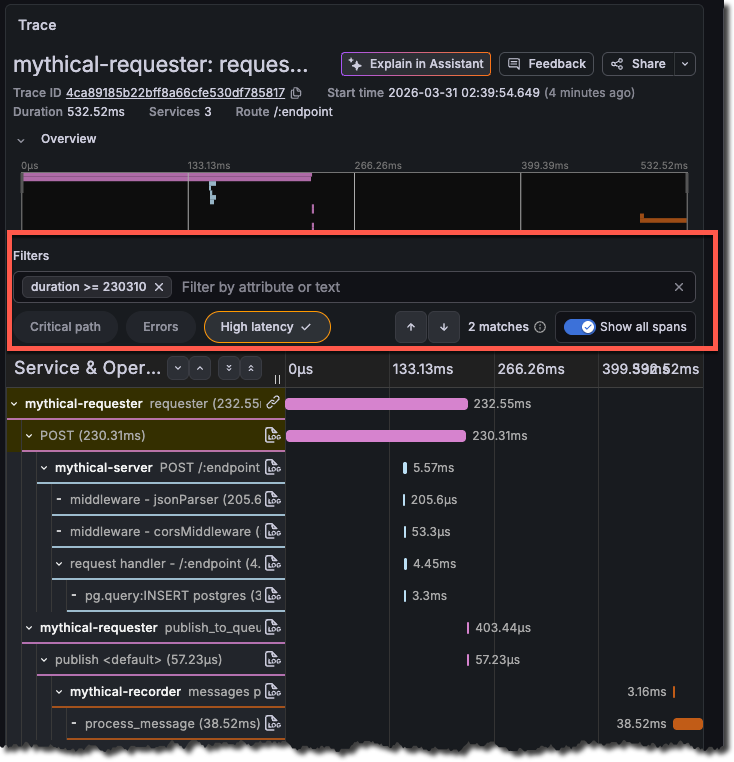
When working with traces, especially those comprising a vast number of spans, pinpointing specific spans of interest can be a daunting task. This is where span filtering comes in. Located above the trace timeline viewer, the Filters bar lets you refine the spans displayed based on specific criteria. Whether you’re looking to identify spans from a certain service, those exceeding a particular duration, or spans tagged with specific attributes, span filtering streamlines the process.
The more filters you add, the more specific the results become.
Tip
If you arrived from the Service Graph, use service.name and status = error filters to drill into the specific service nodes showing errors.
Filter types
The Filters text box lets you pick a key, choose an operator, and enter or select a value.
Available filter keys include:
- Text search: free-text search across span content
- duration: filter by span duration (operators:
=,>=,<=,>,<) - service.name: the service that produced the span
- span.name: the operation name of the span
- status: span status (
ok,error,unset) - kind: span kind (for example,
server,client,internal) - Any span tag, process tag, or log field key present in the trace
For most attribute keys, the available operators are =, !=, =~ (regular expression match), and !~ (regular expression not match).
Note
The same attributes available as filter keys (for example,
span.name,service.name,duration) can be used directly in TraceQL queries.
Quick filter pills
Below the text box, three quick-filter pills let you apply common filters with a single click:
Click a pill to toggle the filter on or off.
Use span filters
The Filters bar is always visible above the trace timeline viewer. To add a filter:
- Click the Filters text box (placeholder text: Filter by attribute or text).
- Select a key from the dropdown (for example, service.name or duration).
- Choose an operator (for example,
=or>=). - Select or type a value. The text box suggests values extracted from the current trace.
The trace timeline viewer updates as you add filters, highlighting the matching spans.
Show all spans
By default, the Show all spans toggle is enabled, meaning all spans remain visible with matching spans highlighted. Turn off Show all spans to hide non-matching spans and display only the spans that meet your filter criteria. This is particularly useful when sifting through thousands of spans, allowing you to zero in on those that truly matter.
The toggle is disabled when no filters are active.
Navigate between matches
Use the up and down arrow buttons next to the match count to jump between matching spans in the trace timeline. The match count displays the current position and total matches (for example, 2/5 matches).
Remove a filter
To remove a filter, click the × on the filter chip below the Filters text box.
Common use cases
To find all errors from a specific service, select service.name = checkout, then click the Errors pill.
To isolate slow database calls, select span.name =~ db\..*, then select duration > 200ms.
To narrow to the critical path only, click the Critical path pill, then turn off Show all spans.
Next steps
- Service Graph: Visualize service relationships and identify error-producing nodes.
- Query editor: Build TraceQL queries using the same attributes available as span filter keys.
- Configure the Tempo data source: Set up your Tempo data source and trace correlations.


