This is documentation for the next version of Grafana documentation. For the latest stable release, go to the latest version.
What’s new in Grafana v10.3
Welcome to Grafana 10.3! Read on to learn about changes to navigation, visualizations and transformations, alerting, profiling, and logs.
We’ve also included here features released in Grafana 10.2.3, as well as breaking changes from that release. Features that were included in the 10.2.3 release are marked with an asterisk.
For even more detail about all the changes in this release, refer to the changelog. For the specific steps we recommend when you upgrade to v10.3, check out our Upgrade Guide.
Breaking changes
For Grafana v10.3, we’ve also provided a list of breaking changes to help you upgrade with greater confidence. For information about these along with guidance on how to proceed, refer to Breaking changes in Grafana v10.3.
Navigation updates*
Available in public preview in Grafana Open Source and Enterprise
The improved navigation menu gives you a better overview by showing all levels of navigation items in a more compact design. We also implemented a better dock and improved scrolling behavior. Furthermore, we improved the structure of the nav menu and added several new items.
Table data in PDF reports
Available in public preview in Grafana Enterprise and Grafana Cloud
We’ve improved the reporting experience with options to make all of your table data accessible in PDFs. Previously, if your dashboard included large table visualizations, you couldn’t see all of the table data in your PDF report. Unlike in Grafana, you couldn’t scroll in the PDF table visualization or click on the page numbers. With this new feature, you now have the option to see all the data directly in your PDF without losing your dashboard layout.
We’ve added two format options to the report creation form:
- Include table data as PDF appendix - Adds an appendix to your dashboard PDF.
- Attach a separate PDF of table data - Generates a separate PDF file for your table panel data.
To try out this feature, enable the pdfTables
feature toggle or contact Grafana Support to have it enabled in on your Grafana Cloud stack.
Dashboards and visualizations
Moving average and trend lines using transformations
Available in public preview in all editions of Grafana
Moving average*
Sometimes your data is too noisy to quickly grasp what’s going on. A common way to address this issue is to calculate the moving mean, or moving average, to filter out some of that noise. Luckily, many data sources already support calculating the moving mean, but when the support is lacking or you’re not well versed in the query language, until now, you were stuck with the noise.

By selecting the Window functions mode and using Mean as the calculation for the Add field from calculation transformation, Grafana adds a field with the moving mean for your selected field.

The Window functions mode also supports moving variance and moving standard deviation calculations if you need to analyze the volatility of your metric.
Trend lines*
We’re also adding some basic statistical analysis features as a way to help you visualize trends in your data. The Regression analysis transformation will fit a mathematical function to your data and display it as predicted data points in a separate data frame.

The transformation currently supports linear regression and polynomial regression to the fifth-degree.
Canvas visualization supports pan and zoom
Available in public preview in all editions of Grafana
Canvas visualizations now support panning and zooming. This allows you to both create and navigate more complex designs.
To enable this feature, you must first enable the canvasPanelPanZoom
feature toggle.
Improved tooltips in visualizations*
Available in public preview in all editions of Grafana
We’ve introduced enhanced tooltips as part of our standardization initiative, unifying the tooltip architecture for a consistent user experience across panels. Packed with features like color indicators, time uniformity, and improved support for long labels, these tooltips go beyond a cosmetic redesign, bringing fundamental changes to elevate your data visualization experience. Stay tuned for more updates!
To try out the new tooltips, enable the newVizTooltips
feature toggle. Enhanced tooltips have been implemented for the following visualizations:
- Time series
- Trend
- Heatmap
- Status history
- Candlestick
- State timeline
- XY Chart
- and more coming soon!
Note
As this is an ongoing project, the dashboard shared cursor and annotations features are not yet fully supported.
Plot enum values in your time series and state timeline visualizations*
Generally available in all editions of Grafana
You can now plot enum values in your time series and state timeline visualizations. This feature is useful when you want to visualize the state of a system, such as the status of a service or the health of a device. For example, you can use this feature to visualize the status of a service as ON, STANDBY, or OFF. To display enum values you can
use the convert field transform.
View percent change in stat visualizations
Generally available in all editions of Grafana
You can now view percent change in stat visualizations. This makes it easier to understand your data by showing how metrics are changing over time.
Apply data transformations to annotations
Generally available in all editions of Grafana
You can now apply data transformations to annotation data. For example, you can now configure how exemplar data is displayed in tooltips.
New Transformations UI experience and documentation upgrades
Generally available in all editions of Grafana
We’ve revamped the Transformations user interface to make it cleaner, more user-friendly, and overall better for visualizing, selecting, and comprehending transformation options for your data.
Improved UI*
In the past, transformations were applied through a dropdown menu, indicated solely by text names like Merge, Sort, JoinByLabels, etc. Now, we’ve introduced a much more user-friendly interface. A convenient drawer allows seamless access to all transformation options, each accompanied by visual/graphical representations and a brief description. These enhancements are designed to enhance the user’s comprehension of their data transformation choices.

In-App documentation
We’ve also streamlined the user experience by integrating documentation directly into the core Grafana application. Gone are the days of navigating to a separate browser page for Transformation documentation. Now, users can conveniently access documentation within the app interface, providing a more seamless and efficient way to understand and utilize various features. This enhancement aims to save time and enhance user convenience, ensuring that valuable information is readily available at their fingertips.

Copy and paste time range
Generally available in all editions of Grafana
Copying and pasting time range in the time range picker is now available. For example, you can copy a time range in Explore and paste it into Dashboards and vice versa. You can also copy and paste a time range using the new keyboard shortcuts t+c and t+v, respectively.
Profiles
Trace to Profiles*
Experimental in all editions of Grafana
Using Trace to profiles, you can use Grafana’s ability to correlate different signals by adding the functionality to link between traces and profiles.
Trace to profiles lets you link your Grafana Pyroscope data source to tracing data. When configured, this connection lets you run queries from a trace span into the profile data.
There are two ways to configure the trace to profiles feature:
- Use a simplified configuration with default query, or
- Configure a custom query where you can use a template language to interpolate variables from the trace or span.

To try out Trace to profiles, enable the ’traceToProfiles’ feature toggle.
If you would also like to try out the Embedded Flame Graph feature, please enable the ’tracesEmbeddedFlameGraph’ feature toggle.
Note: in order to determine that there is a profile for a given span and render the ‘Profiles for this span’ button or the embedded flame graph in the span details, the ‘pyroscope.profile.id’ key-value pair must exist in your span tags.
FlameGraph: Collapsing similar items in the graph*
Experimental in all editions of Grafana
Sometimes profile stacks contain lots of levels with similar repeating items, for example long stacks of framework code that usually isn’t of interest but takes up a lot of visual real estate. With this feature, instead of rendering all of the similar items we render only one and allow to expand those collapsed items on demand.
To try it out, enable the ‘traceToProfiles’ feature toggle. To enable it in your Grafana Cloud stack, contact Grafana Support.
Alerting
Alerting insights*
Generally available in all editions of Grafana
Use Alerting insights to monitor your alerting data, discover key trends about your organization’s alert management performance, and find patterns in why things go wrong.
Export alerting resources to Terraform
Generally available in all editions of Grafana
Export your alerting resources, such as alert rules, contact points, and notification policies as Terraform resources. A new “Modify export” mode for alert rules enables you to edit provisioned alert rules and export a modified version.
Contact points list view redesign
Generally available in all editions of Grafana
The Contact points list view has been redesigned and split into two tabs: Contact Points and Notification Templates, making it easier to view all contact point information at a glance. You can now search for name and type of contact points and integrations, view how many notification policies each contact point is being used for, and navigate directly to the linked notification policies.
Create alerts from panels*
Generally available in all editions of Grafana
Create alerts from dashboard panels. You can reuse the panel queries and create alerts based on them.
Support for adding responders to Opsgenie alerting contact point*
Generally available in all editions of Grafana
The Opsgenie contact point has been extended to allow users to optionally fill out responder information for their integration. Responders tell Opsgenie who an alert should notify according to their escalation policies and routing rules.
Recovery thresholds for alerts
Generally available in all editions of Grafana
To reduce the noise of flapping alerts, you can set a recovery threshold different to the alert threshold.
Flapping alerts occur when a metric hovers around the alert threshold condition and may lead to frequent state changes, resulting in too many notifications being generated.
Logs
Logs Table UI
Available in public preview in all editions of Grafana
Table view was created to help facilitate ease of use in a point and click UI, as opposed to datasource specific query language formatting options, like loki’s line_format.
Tables can be configured and shared with team members via explore URLs or by adding the table to a dashboard panel.
Data sources
Data source Admin permission*
Generally available in Grafana Enterprise and Grafana Cloud
In addition to Query and Edit access, you can now grant users, teams, or basic roles Admin access to data sources. Users with Admin access to a data source can grant and revoke permissions to the data source, as well as to manage query caching settings for the data source. Users are automatically granted Admin access to data sources that they create.
Redshift and Athena: Async query caching
Generally available in Grafana Enterprise, Grafana Cloud Advanced and Cloud Pro
Introducing query caching for async queries in the Athena and Redshift data source plugins. We previously introduced async queries for the Athena and Redshift plugins, and this feature adds support for caching those queries. To use this, you must have query caching enabled for the Athena or Redshift data source you wish to cache. This feature was previously available behind a feature toggle and is now generally available and enabled by default.
Note
The
useCachingServicefeature toggle must also be enabled to use this feature.
Loki data source improvements: “or” filter syntax, filter by label types, derived fields by labels
Generally available in all editions of Grafana
Introducing several improvements to the Loki data source.
Line filter “or” syntax*
Loki’s line filter syntax is great to find specific substrings of your log lines. If users want to find multiple different substrings it was cumbersome to use the regex =~ operator. With this change it is possible to chain multiple strings with the existing filter operators.
Example:
{app="foo"} |= "foo" or "bar" != "baz" or "qux"Filter based on label type*
Grafana users can use the action buttons in the log details to filter for specific labels. Those would be always added as a LabelFilter expression regardless of the type of the label. Now, filtered labels will be added either to the stream selector if the label is an indexed label, or as a LabelFilter expression if the label is a parsed label or part of structured metadata.
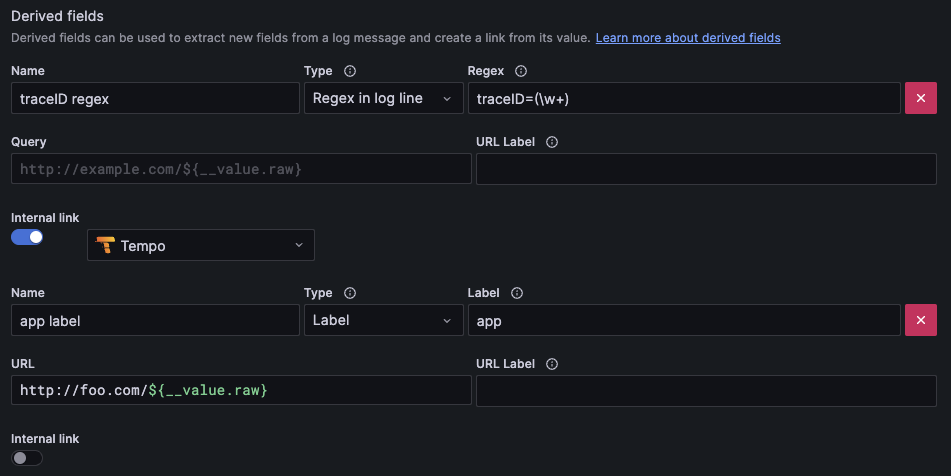
Derived fields based on labels*
Derived fields or data links are a concept to add correlations based on your log lines. Previously it was only possible to add derived fields based on a regular expression of your log line and doing it based on labels was not possible. With this change derived fields can be added either based on a regex of a log line or based on a label, parsed label or structured metadata.
The following example would add the derived field traceID regex based on a regular expression and another app label field based on the app label.
InfluxDB native SQL support
Generally available in all editions of Grafana
InfluxDB introduced a new version, 3.0, in April. With this new version, InfluxDB has put Flux in maintenance mode. But with the new version we have a new querying language, Native SQL. With v10.3.0, Grafana has built-in support for SQL query language in InfluxDB.
All you need to do is set up your InfluxDB Cloud Account and create your InfluxDB data source on Grafana with the query language “SQL” selected.
Authentication and authorization
Grafana Anonymous Access*
Generally available in Grafana Open Source and Enterprise
We’ve identified a need for users who enable anonymous authentication to monitor the anonymous devices connected to their Grafana instance. This feature is part of our ongoing efforts to enhance control and transparency regarding anonymous usage.
Anonymous access now allows users, including those in open-source and enterprise self-managed environments, to view and monitor their anonymous access. They can also set a device limit, configuring a specific number of anonymous devices to connect to their instance.
Once this limit is reached, any new devices attempting to connect will be denied access until existing devices disconnect.
The anonymous devices feature improves the management and monitoring of anonymous access within your Grafana instance.
Anonymous Device:
When anonymous access has been enabled, any device which accesses Grafana in the last 30 days (without logging in) is considered an active anonymous device. Users can now view anonymous devices on the users page, anonymous usage statistics, including the count of devices and users over this period.
Grafana UI:
Navigate to Administration -> Users to access the anonymous devices tab.
A new statistic has been added to the Usage & Stats page, displaying active anonymous devices from the last 30 days.


