
This is documentation for the next version of Grafana documentation. For the latest stable release, go to the latest version.

Text
Note
The new text panel is currently in public preview. Grafana Labs offers limited support, and breaking changes might occur prior to the feature being made generally available.
To use this feature, enable the
grafana.newTextPanelandtext.newFeaturesfeature toggles in your Grafana configuration file or contact Support.For information about the generally available experience, refer to the latest OSS documentation.
Text visualizations let you include text, HTML, code blocks, or Mermaid diagrams in your dashboards. You can use them to add contextual information and descriptions or to embed complex HTML. With text visualizations, you can build things like lightweight data-driven tables, cards, lists, and status summaries.
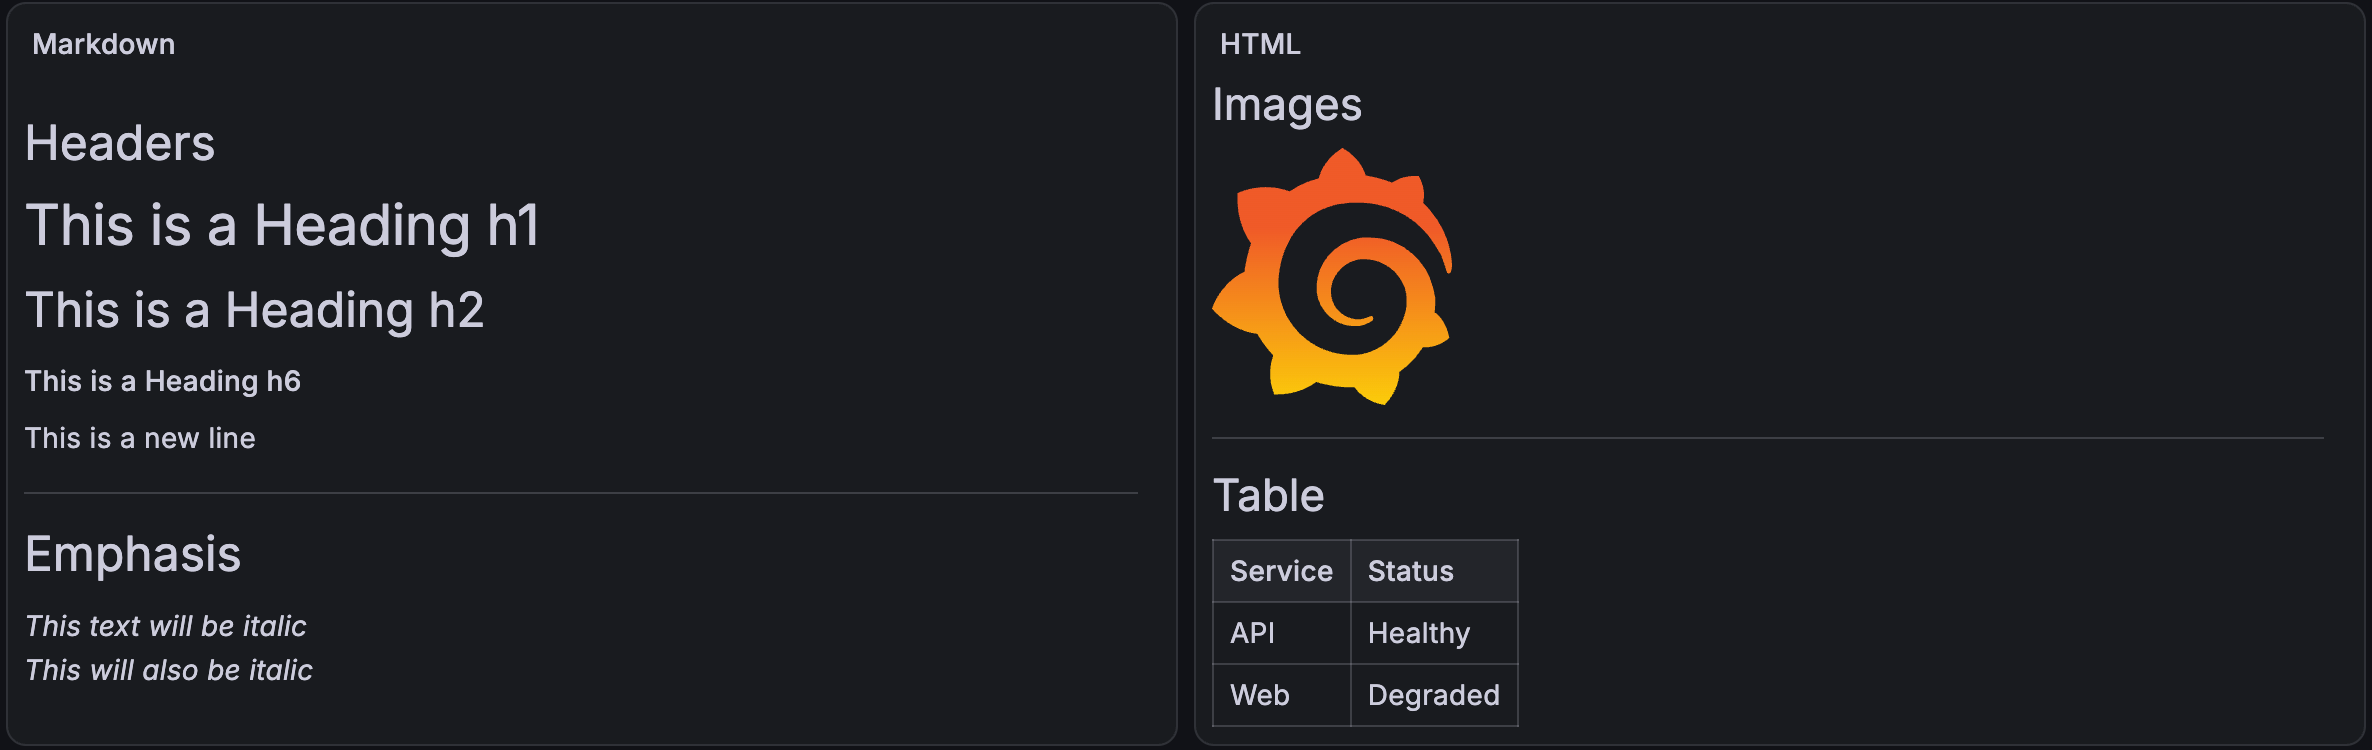
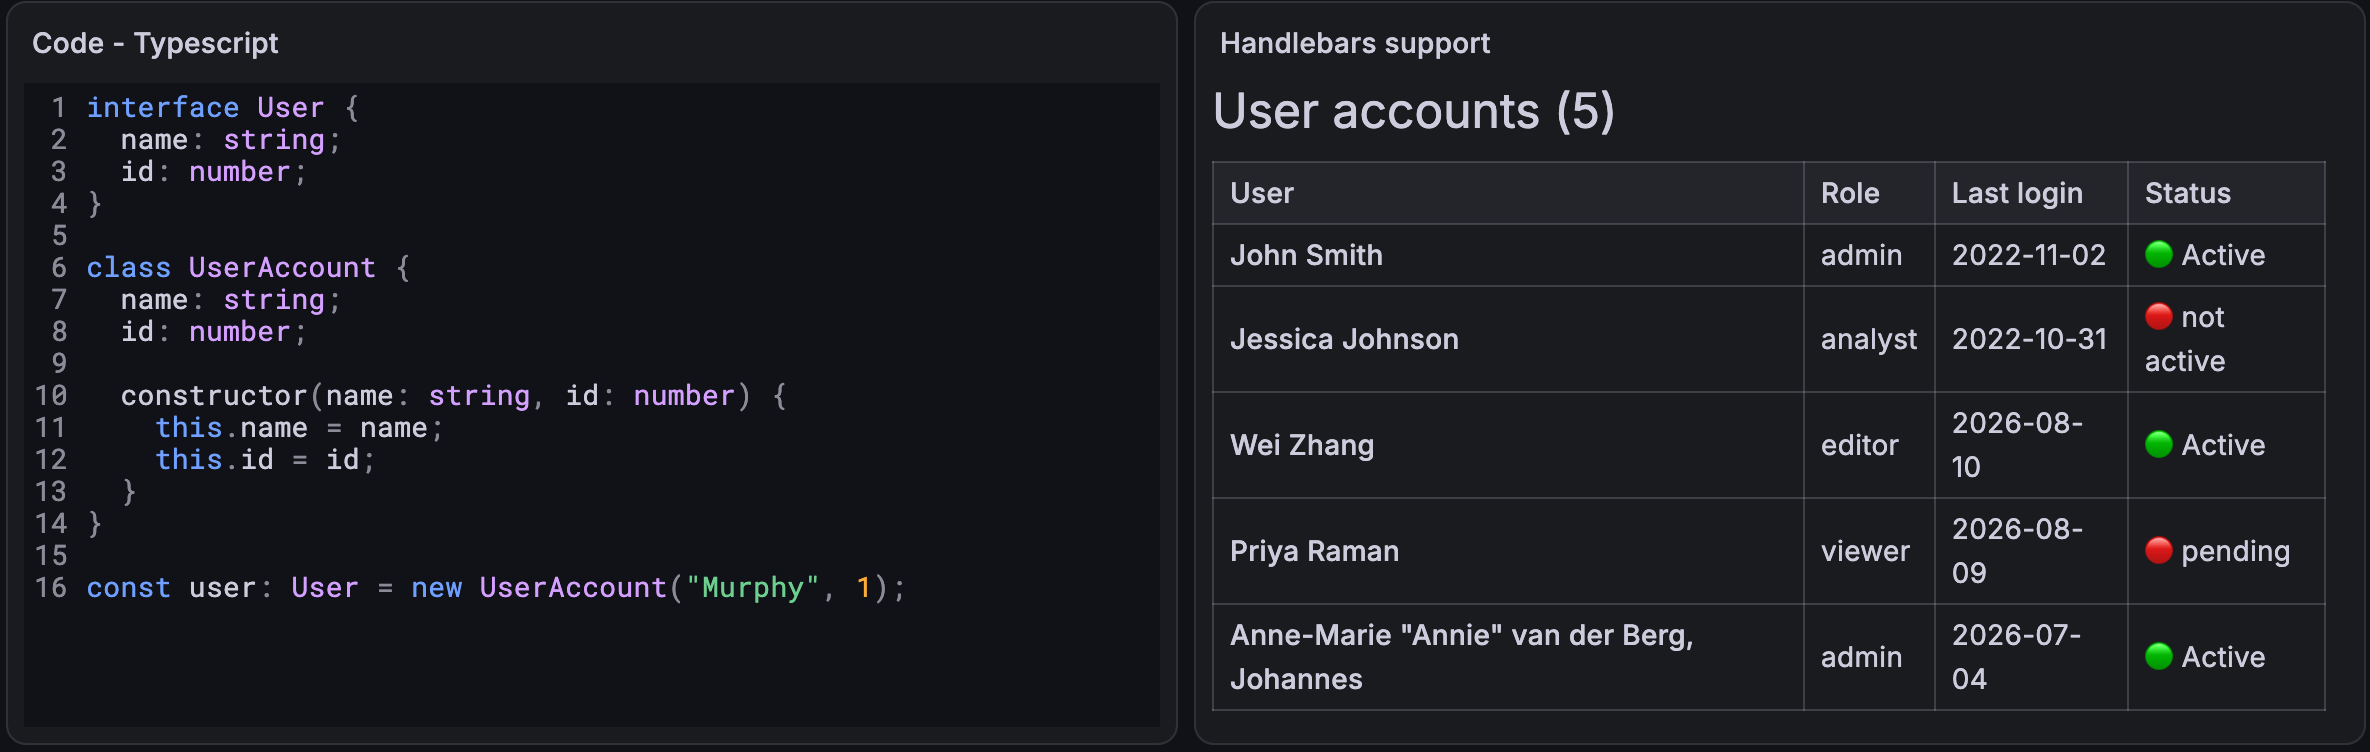
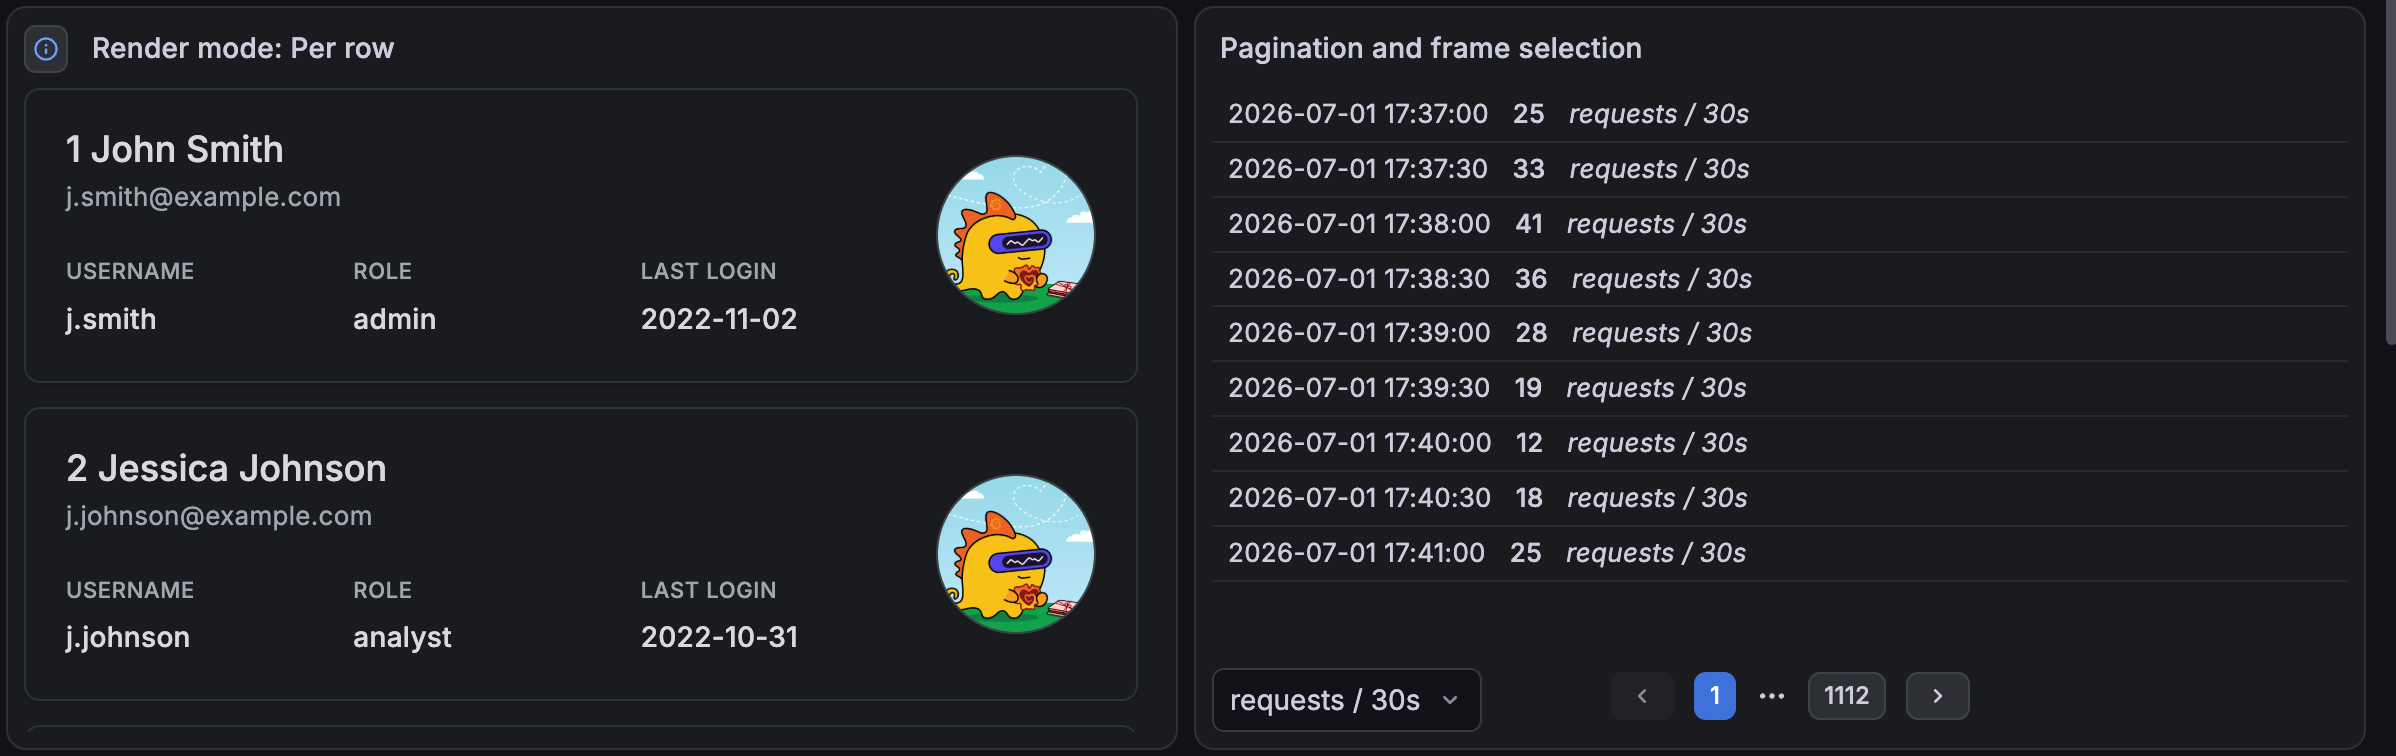
The following images show different uses of the text visualization.
Here, text visualizations use Markdown and HTML modes:
In this example, one text visualization is in TypeScript mode and the other is using Handlebars templating:
Finally, this image shows one text visualization using per row render mode and another using pagination:

With Grafana Play, you can explore and see how it works, learning from practical examples to accelerate your development. This feature can be seen on Text Panel.
Use a text visualization when you need to:
- Add important links or useful annotations.
- Provide instructions or guidance on how to interpret different panels, configure settings, or take specific actions based on the displayed data.
- Announce any scheduled maintenance or downtime that might impact your dashboards.
Text visualization editor
The editor is where you enter and preview the content of a text visualization. It’s where you set text modes, like Markdown, HTML, or a specific coding language. Additionally, it provides formatting options and syntax highlighting, as well as variable and diagram support.
To learn more, click the following links:
Views
The editor provides three views:
- Preview: See only the preview block.
- Split: See the authoring and preview blocks at the same time.
- Write: See only the authoring block.
Toolbar
The toolbar provides formatting options for common Markdown and HTML operations, like bold or italic text and lists. You can also insert:
- Tables
- Mermaid diagrams
- Dashboard variables
Dashboard variables autocomplete as you enter them, and they’re interpolated in the content.
The options displayed in the formatting toolbar depend on whether you select Markdown or HTML.
Modes
The visualization mode determines how embedded content appears. Choose from:
- Markdown: Formats the content as Markdown.
- HTML: Renders the content as sanitized HTML. If you require more direct control over the output, you can set the
disable_sanitize_htmlflag which enables you to directly enter HTML. - Code: Renders content inside a read-only code editor. Variables in the content are expanded for display. The code options are: Go, HTML, JSON, Markdown, Plain text, SQL, TypeScript, XML, YAML.
The editor provides syntax highlighting in the authoring block.
Note
To allow embedding of iframes and other websites, you need set
allow_embedding = truein your Grafanaconfig.inior environment variables, depending on your deployment.
Render query results as text with Handlebars templates
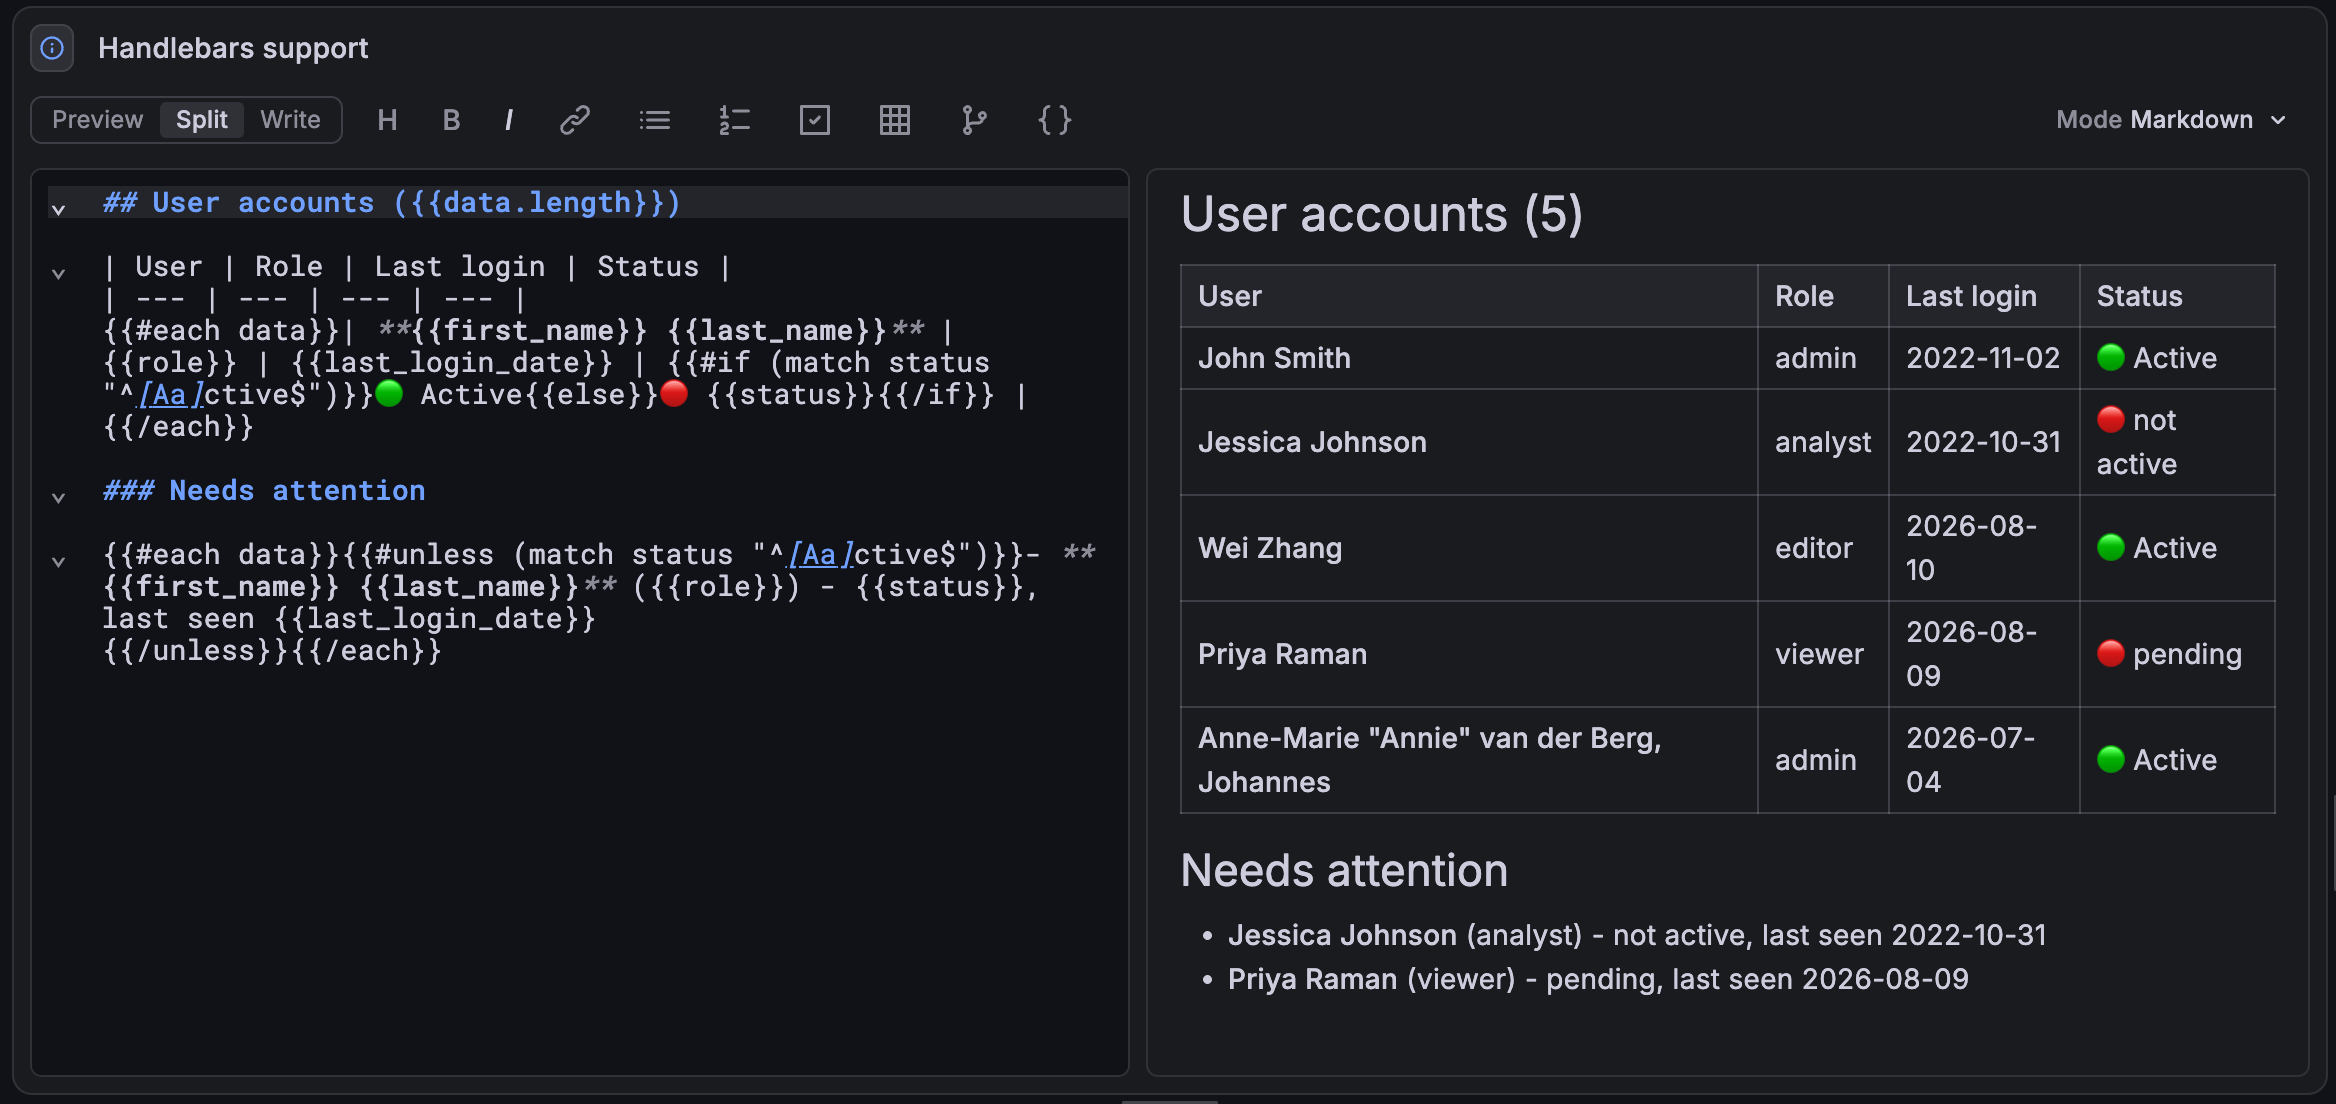
Use ${__value}, ${__field}, ${__series}, and ${__data} macros to reference query results in the visualization content, and Handlebars templating for more control.
Choose what data to display, repeat content for each row with {{#each}}, and add if/then logic with {{#if}} helpers.
Configuration options
The following section describes the configuration options available in the panel editor pane for this visualization. These options are, as much as possible, ordered as they appear in Grafana.
Panel options
In the Panel options section of the panel editor pane, set options like the panel title, description, and show/hide rules. To learn more, refer to Configure panel options.
Data options
Use the following options to control how data is rendered in the text visualization.
Render mode
Select a render mode to control how your template is applied:
- Once: Render the whole result.
- Per row: Each row in the data gets its own repeated block of content.
You can also select which data frame to display.
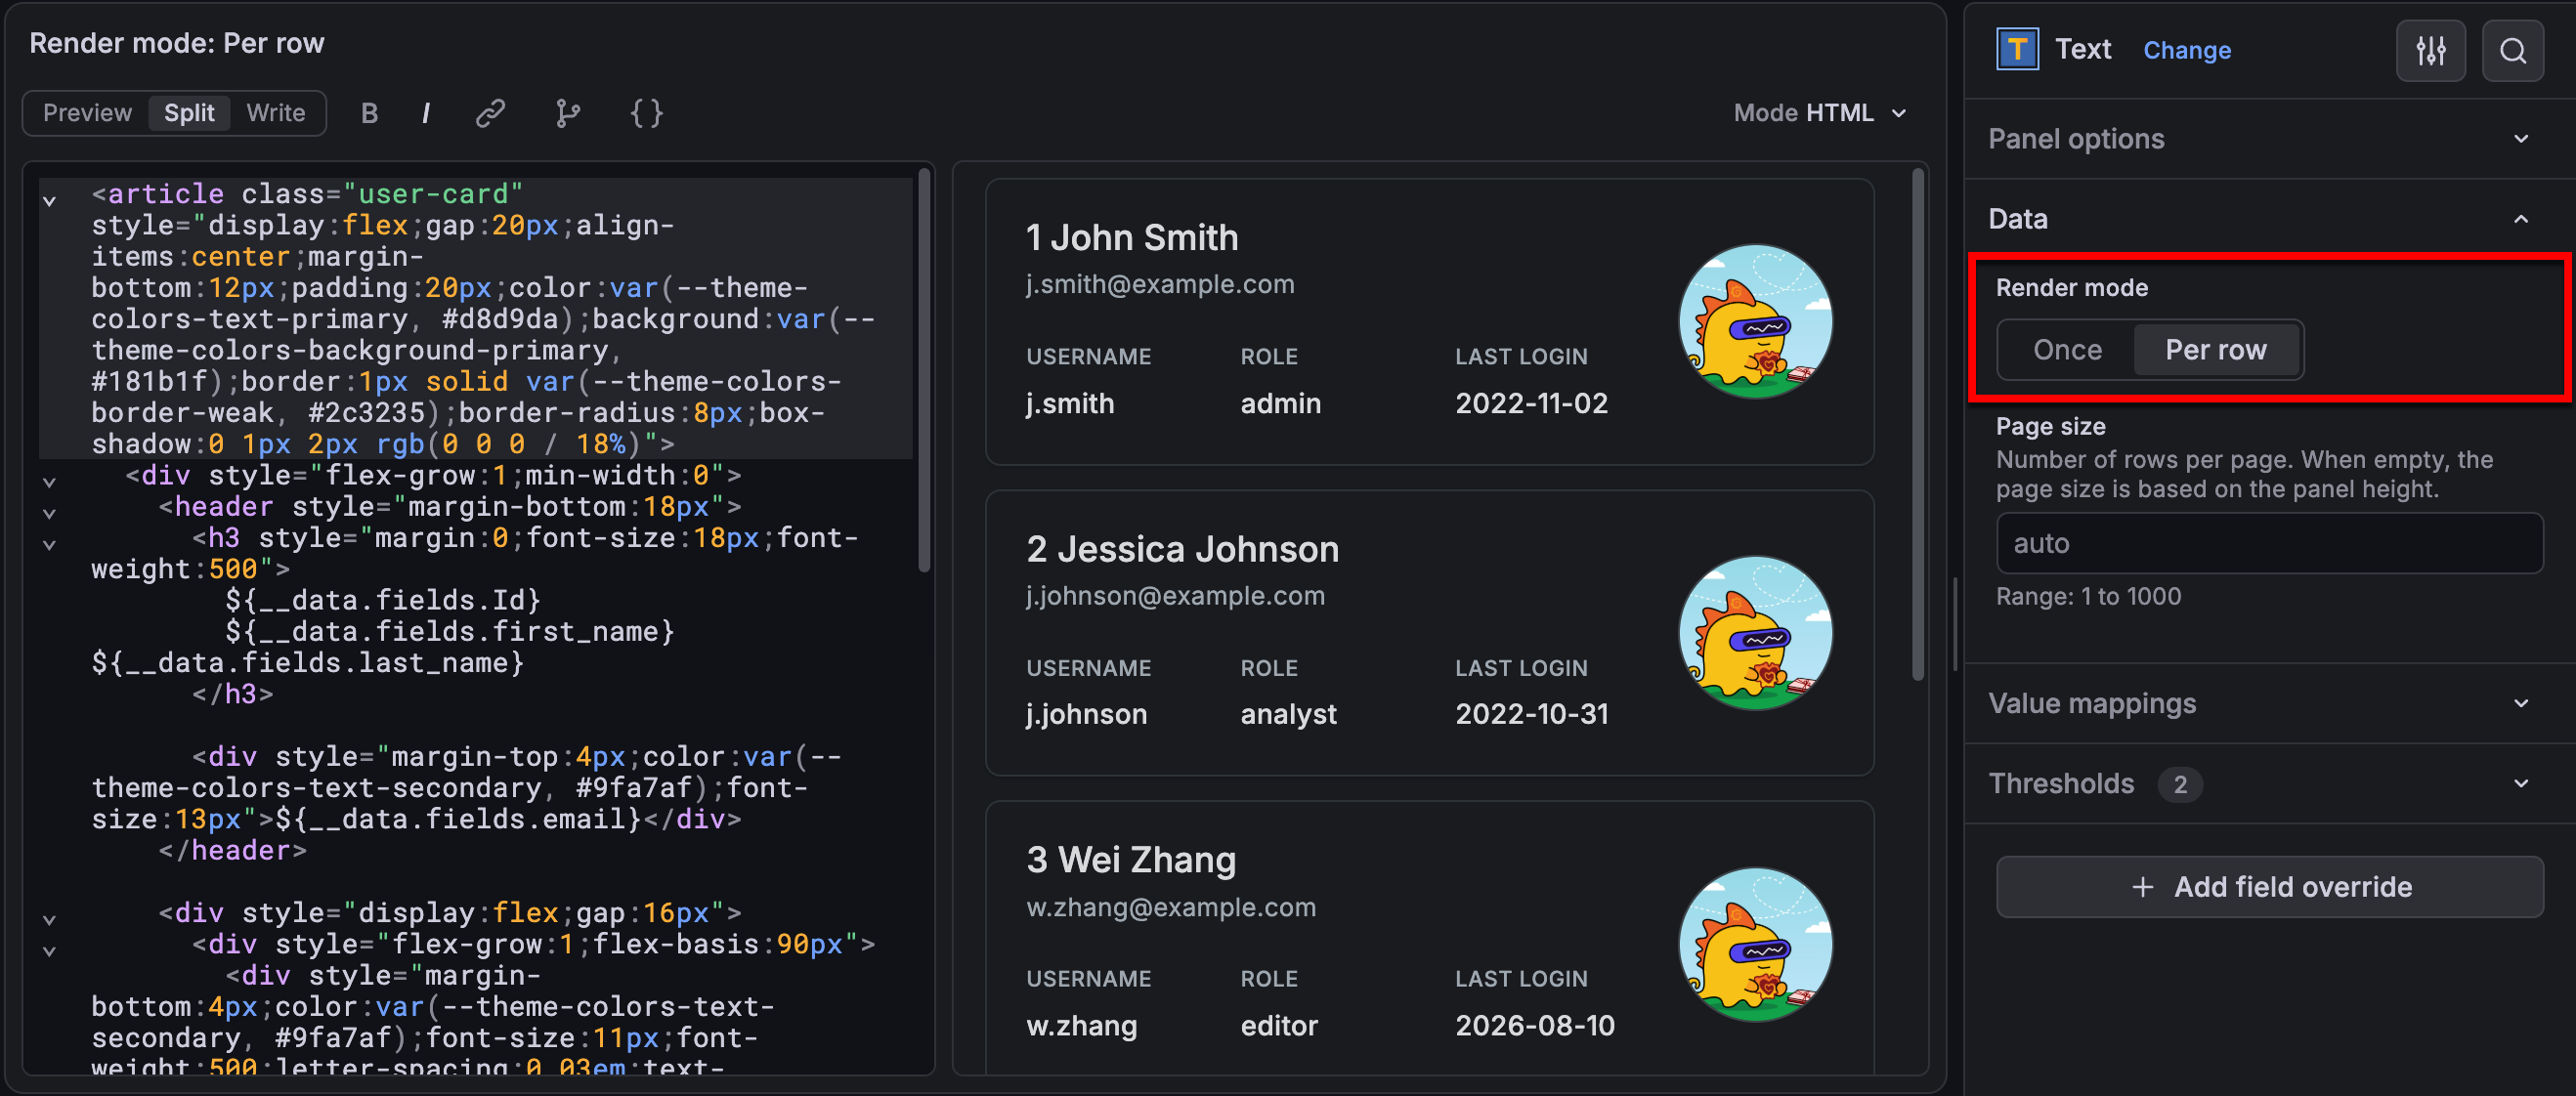
Page size
When a query returns many rows, pagination lets you move through the full result instead of showing only a limited number of rows. Grafana automatically adjusts the number of rows on each page to fit the panel or you can set a range from 1-1000 rows.
This option only displays when you set Render mode to Per row and when there are 100 rows or more.
Value mappings
Value mapping is a technique you can use to change how data appears in a visualization.
For each value mapping, set the following options:
- Condition - Choose what’s mapped to the display text and (optionally) color:
- Value - Specific values
- Range - Numerical ranges
- Regex - Regular expressions
- Special - Special values like
Null,NaN(not a number), or boolean values liketrueandfalse
- Display text
- Color (Optional)
- Icon (Canvas only)
To learn more, refer to Configure value mappings.
Thresholds
A threshold is a value or limit you set for a metric that’s reflected visually when it’s met or exceeded. Thresholds are one way you can conditionally style and color your visualizations based on query results.
For each threshold, set the following options:
To learn more, refer to Configure thresholds.
Field overrides
Overrides allow you to customize visualization settings for specific fields or series. When you add an override rule, it targets a particular set of fields and lets you define multiple options for how that field is displayed.
Choose from the following override options:
To learn more, refer to Configure field overrides.
Was this page helpful?
Related resources from Grafana Labs



