This is documentation for the next version of Grafana documentation. For the latest stable release, go to the latest version.
Prometheus query editor
The Prometheus query editor lets you write PromQL queries against your Prometheus-compatible data sources. It includes a visual query builder for constructing queries without writing PromQL, a code editor with autocomplete and syntax highlighting, and configurable output formats for different visualization types.
You can access the query editor from the Explore page or from any dashboard panel by clicking the panel title and selecting Edit. For general documentation on querying data sources in Grafana, refer to Query and transform data. For more information about PromQL, see Querying Prometheus.
The query editor has two modes:
- Builder mode — Visual interface for constructing queries without writing PromQL directly.
- Code mode — Text editor with autocomplete for writing PromQL directly.
Grafana synchronizes both modes, allowing you to switch between them. Grafana also displays a warning message if it detects an issue with the query while switching modes.
Query options
The following options are available in both Builder and Code modes. They control how the query is executed and how results are displayed.

Legend
Controls the display name for time series in the panel legend.
- Auto — Displays unique labels only, hiding labels that are common across all returned series. This produces cleaner legends when many series share the same labels.
- Verbose — Displays all label names for every series.
- Custom — Lets you define the legend using label templates. For example,
{{hostname}}is replaced with the value of thehostnamelabel. To switch to a different legend mode, clear the input and click outside the field.
Min step
Sets the minimum interval between data points returned by the query. For example, setting this to 1h means data is returned at hourly intervals at minimum. This setting supports the $__interval and $__rate_interval macros.
Note
The time range of the query is aligned to the step size, which may adjust the actual start and end times of the returned data.
Format
Determines how query results are interpreted and displayed in a panel.
- Time series — The default format. Returns data as time-indexed series suitable for graph panels.
- Table — Displays data in a tabular format. Works only in a Table panel.
- Heatmap — Displays histogram-type metrics in a Heatmap panel by converting cumulative histograms to regular ones and sorting the series by bucket boundary.
Type
Determines the query type.
- Both — The default. Runs both a Range query and an Instant query and returns combined results.
- Range — Returns a set of time series where each series includes multiple data points over the selected time range. Use this for graph visualizations (lines, bars, points, stacked).
- Instant — Returns a single data point per series (the most recent value within the selected time range). Use this for stat panels, tables, or gauges. To visualize instant query results in a time series panel, add a field override with the
Transformproperty set toConstant. For more information, refer to Time Series Transform option.
Note
Grafana adjusts the query time range to align with the dynamically calculated step interval. This ensures consistent metric visualization and supports Prometheus result caching. However, this alignment can cause minor visual differences, such as a slight gap at the graph’s right edge or a shifted start time. For example, a
15sstep aligns timestamps to Unix times divisible by 15 seconds. A1wMin step aligns the range to the start of the week (Thursday at 00:00 UTC in Prometheus).
Exemplars
Toggle on to include exemplars in the graph. Exemplars link aggregated metric data to specific trace examples, letting you jump from a spike directly to a relevant trace. For more information, see Introduction to exemplars.
Note
Exemplars are not available with Instant query types.
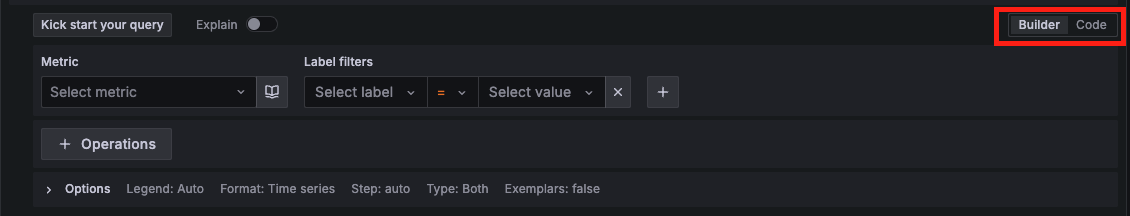
Builder mode
Builder mode helps you build queries using a visual interface. This option is best for users who have limited experience with PromQL.
Builder mode contains the following components:
Kick start your query — Click to view predefined operation patterns that help you quickly build queries with multiple operations:
- Rate query starters
- Histogram query starters
- Binary query starters
Click the arrow next to each to see the available options.
Explain — Toggle on to display a step-by-step explanation of all query components and operations.

Select a metric

- Metric — Select a metric from the drop-down. The data source provides available metrics based on the selected time range. You can type to search and filter the list. Click the book icon to open Metrics explorer.
- Label filters — Select labels and values to filter the metric. Use the
+button to add filters and thexbutton to remove them. When a metric is selected, the data source requests available labels and their values from the server.
Add operations

Click + Operations to add operations to your query. The query editor groups operations into the following categories:
- Aggregations —
sum,avg,count,min,max, etc. - Range functions —
rate,increase,irate,avg_over_time, etc. - Functions —
abs,ceil,histogram_quantile, etc. - Binary operations — arithmetic and comparison operators.
- Trigonometric functions —
acos,asin,atan, etc. - Time functions —
time,timestamp,day_of_week, etc.
All operations display function parameters beneath the operation header. Some operations allow you to apply specific labels (for example, by or without clauses).

If you add an operation in a way that would create an invalid query, the query editor automatically places it in the correct position to maintain a valid query structure.
Hints
The query editor can detect which operations are most appropriate for certain selected metrics. When it does, it displays a hint next to the + Operations button. Click the hint to add the suggested operation.

Metrics explorer

Click the book icon next to the metric selector to open the Metrics explorer. It displays all metrics in a paginated list showing the name, type, and description for each metric.
The following options are available under Additional Settings:
- Include description in search — Search by both name and description.
- Include results with no metadata — Include metrics that lack type or description metadata.
- Disable text wrap — Disable text wrapping for long metric names.
- Enable regex search — Filter metric names by regular expression, which uses an additional API call.
Note
The Metrics explorer (Builder mode) and Metrics browser (Code mode) are separate components. The Metrics explorer does not browse labels, but the Metrics browser can display all labels on a metric.
Code mode
Code mode is for experienced Prometheus users who prefer writing PromQL directly. For more information about PromQL, see Querying Prometheus.

Code mode provides:
- Autocomplete — Suggests metrics, labels, functions, aggregations, and keywords as you type. The drop-down includes documentation for suggested items where available.
- Syntax highlighting — Color-codes PromQL syntax for readability.
- Metrics browser — Click the arrow next to Metrics browser to open it.
Metrics browser
The Metrics browser helps you build basic queries by exploring available metrics and labels.

- Step 1 — Select a metric. The browser narrows available labels to those applicable to the metric.
- Step 2 — Select one or more labels.
- Step 3 — Select values for each label to tighten the query scope.
- Step 4 — Choose an action:
- Use query — Insert the selector into the query editor.
- Use as rate query — Insert the selector wrapped in
rate(...[$__rate_interval]). - Validate selector — Verify the selector is valid and display the number of matching series.
- Clear — Reset your selections.
Note
If you don’t remember the exact metric name, start by selecting a few labels to filter the list and narrow down your options.
All lists in the Metrics browser include a search field. In the Values section, a single search field filters across all selected labels.
Common query patterns
The following examples show frequently used PromQL patterns. Each example includes the PromQL expression and guidance on which query options to use.
Request rate per service
Calculate the per-second rate of HTTP requests, broken down by service:
sum(rate(http_requests_total[$__rate_interval])) by (service)Builder mode steps: Select http_requests_total → Add operation Range functions > Rate → Add operation Aggregations > Sum → Set by label to service.
Error rate percentage
Calculate the percentage of requests that returned 5xx errors:
sum(rate(http_requests_total{status=~"5.."}[$__rate_interval])) / sum(rate(http_requests_total[$__rate_interval])) * 100Histogram quantile (p95 latency)
Calculate the 95th percentile request duration from a histogram metric:
histogram_quantile(0.95, sum(rate(http_request_duration_seconds_bucket[$__rate_interval])) by (le))Builder mode steps: Select http_request_duration_seconds_bucket → Add Range functions > Rate → Add Aggregations > Sum with by label le → Add Functions > Histogram quantile with value 0.95.
Aggregation by label (CPU usage per instance)
Calculate average CPU usage percentage, grouped by instance:
100 - (avg by (instance) (rate(node_cpu_seconds_total{mode="idle"}[$__rate_interval])) * 100)Multi-query expressions (available memory percentage)
Use multiple queries and expressions to calculate derived values. In the query editor, add multiple queries (A, B) and a math expression (C):
Query A — Total memory:
node_memory_MemTotal_bytesQuery B — Available memory:
node_memory_MemAvailable_bytesExpression C — Percentage available (click + Expression → Math):
$B / $A * 100Set queries A and B to Type: Instant and hide them from visualization (click the eye icon). Display only expression C.
Alert-compatible query (target down)
A simple alert query that fires when a scrape target is down:
up{job="my-service"} == 0Note
Alert queries don’t support template variables (
$variable). Use fixed label values when writing queries intended for alert rules.
Use the query inspector
The query inspector helps you debug queries that return unexpected results or no data. To open it:
- Click Query inspector in the panel edit view (below the query editor).
- Review the following tabs:
- Query — Shows the exact request sent to Prometheus, including the evaluated PromQL expression, time range, and step interval. Use this to verify that template variables resolved correctly.
- Data — Shows the raw response data. If empty, your query matched no series.
- Stats — Shows request timing and response size.
Common debugging steps:
- No data returned — Check the Query tab to see if template variables resolved to empty values. Try the query directly in the Prometheus built-in expression browser (
/graph) to rule out Grafana-specific issues. - Fewer series than expected — Check that your label filters aren’t too restrictive. Remove filters one at a time to isolate which filter is excluding data.
- “Too many data points” or timeout — Reduce the time range, increase the Min step, or add aggregations to reduce cardinality. Refer to Query high-cardinality data.
Query high-cardinality data
High-cardinality metrics (those with many unique label combinations) can cause queries to timeout or exceed memory limits when queried over long time ranges. Follow these practices to query high-cardinality data effectively:
- Aggregate first, then filter — Use
sum(),avg(), orcount()to reduce the number of series before applying other operations. For example,sum(rate(metric[5m])) by (service)is far cheaper than querying all individual pod-level series. - Use recording rules for repeated queries — If a dashboard panel queries the same expensive expression on every load, create a Prometheus recording rule to pre-compute the result.
- Scope with template variables — Use dashboard
template variables to select a specific
namespace,cluster, orjobrather than querying all labels at once. - Increase Min step for overview panels — For panels showing trends over days or weeks, set a higher Min step (for example,
5mor15m) to reduce the number of data points requested. - Set Max data points — Use the Max data points query option to cap resolution for wide time ranges.
- Use Adaptive Metrics (Grafana Cloud) — Adaptive Metrics automatically reduces the cardinality of metrics that aren’t queried at full resolution.
If your queries hit memory or sample limits, refer to Memory limit exceeded for high-cardinality queries.
Expected PromQL behaviors
The following behaviors are frequently misinterpreted as bugs but are expected Prometheus behavior.
increase() returns fractional values on integer counters
increase() uses linear interpolation to estimate the increase over the specified time window. Because scrape timestamps rarely align exactly with the window boundaries, the result is interpolated — which produces fractional values even for integer counters.
This is expected. If you need integer results, wrap the expression in ceil() or floor():
ceil(increase(http_requests_total[5m]))rate() appears to grow over time
If rate() shows an ever-increasing value instead of a steady per-second rate, the most common cause is multiple instances writing to the same time series without unique distinguishing labels. Prometheus merges these into a single series with an artificially growing counter.
To fix this, ensure every scrape target has unique labels (for example, instance, pod, or node). Then aggregate explicitly:
sum(rate(http_requests_total[5m])) by (job)If you see this after a deployment or scaling event, verify your service discovery is assigning unique instance labels to each target.
Counter reset spikes after pod restarts
When a monitored process restarts, its counters reset to zero. Prometheus handles this with counter reset detection — rate() and increase() account for resets and don’t produce negative values. However, you may still see a brief spike at the reset point because the first scrape after a restart reports the full counter value accumulated since the restart.
To minimize the visual impact:
- Use
rate()over a window that spans multiple scrape intervals (for example,$__rate_interval) so the spike is averaged out. - For critical dashboards, apply smoothing with a longer range vector or use
avg_over_time()on top ofrate(). - If you’re seeing large spikes from frequent pod restarts, investigate the restart frequency rather than trying to hide the spikes in queries.
Label cardinality causes “too many time series” errors
If adding a label filter doesn’t reduce the result count, you may have high-cardinality labels (such as request_id or user_id) on your metrics. Use the Prometheus TSDB status page (/tsdb-status) or the Grafana Metrics explorer to identify high-cardinality label combinations, then either drop unnecessary labels at scrape time or use aggregation in your queries.
Related resources
- Template variables — Use variables like
$namespaceor$jobto create dynamic, reusable dashboards. - Annotations — Overlay Prometheus events on your panels.
- Alerting — Create alert rules from your Prometheus queries.
- Troubleshooting — Resolve common query errors and performance issues.