This is documentation for the next version of Grafana documentation. For the latest stable release, go to the latest version.
PostgreSQL query editor
The PostgreSQL query editor lets you build and run queries against your data source. For general query editor and data transformation concepts, refer to Query and transform data.
You can open the PostgreSQL query editor from the Explore page or from a dashboard panel—click the ellipsis in the upper right of the panel and select Edit.
Note
A default database must be configured in the data source settings. If none is set, or it is removed, the data source will not run queries until a database is configured again.
PostgreSQL query editor components
The PostgreSQL query editor has two modes: Builder and Code.
Builder mode helps you build a query using a visual interface. Code mode allows for advanced querying and offers support for complex SQL query writing.
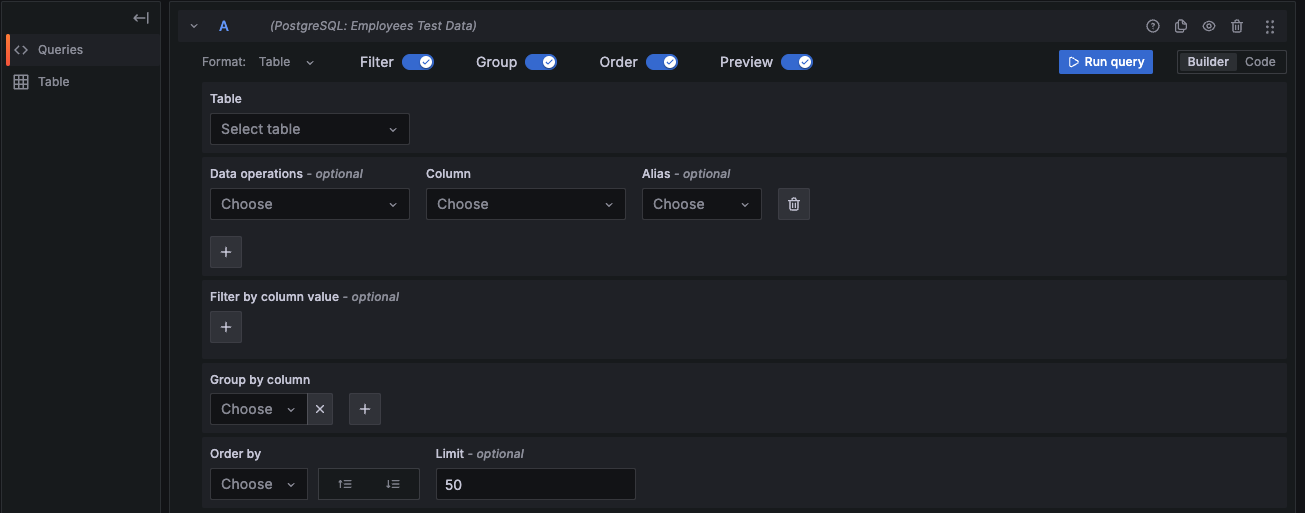
PostgreSQL Builder mode
The following components will help you build a PostgreSQL query:
- Format - Select the query result format from the drop-down. The default is Table. If you use the Time series format option, one of the columns must be
time. Refer to Time series queries for more information. - Table - Select a table from the drop-down. Tables correspond to the chosen database.
- Data operations - Optional Select an aggregation from the drop-down. You can add multiple data operations by clicking the + sign. Click the X sign to remove data operations.
- Column - Select a column on which to run the aggregation.
- Alias - Optional Add an alias from the drop-down. You can also add your own alias by typing it in the box and clicking Enter. Remove an alias by clicking the X.
- Filter - Toggle to add filters.
- Filter by column value - Optional If you toggle Filter, you can add a column to filter by from the drop-down. To filter on more columns, click the + sign to the right of the condition drop-down. Choose an operator from the drop-down next to the condition. When multiple filters are added, you can add an
ANDoperator to display all true conditions or anORoperator to display any true conditions. Use the second drop-down to choose a filter value. To remove a filter, click the X next to that filter’s drop-down. After selecting a date-type column, you can choose Macros from the operators list and selecttimeFilterto add the$__timeFiltermacro to the query with the selected date column. - Group - Toggle to add Group by column.
- Group by column - Select a column to group by from the drop-down. Click the + sign to group by multiple columns. Click the X to remove a column.
- Order - Toggle to add an
ORDER BYstatement. - Order by - Select a column to order by from the drop-down. Select ascending (
ASC) or descending (DESC) order. - Limit - You can add an optional limit on the number of retrieved results. Default is 50.
- Preview - Toggle for a preview of the SQL query generated by the query builder. Preview is toggled on by default.
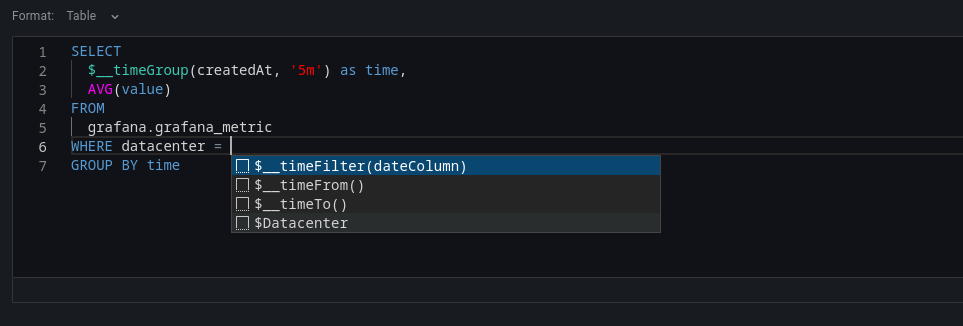
PostgreSQL Code mode
To create advanced queries, switch to Code mode by clicking Code in the upper right of the editor window. Code mode supports the auto-completion of tables, columns, SQL keywords, standard SQL functions, Grafana template variables, and Grafana macros. Columns cannot be completed before a table has been specified.
Note
If a table or column name is a reserved word or contains mixed case or special characters, use double quotes in SQL. For example,
"user"or"Created At".
Select Table or Time Series as the format. Click the {} in the bottom right to format the query. Click the downward caret to expand the Code mode editor. CTRL/CMD + Return serves as a keyboard shortcut to execute the query.
Warning
Changes made to a query in Code mode will not transfer to Builder mode and will be discarded. You will be prompted to copy your code to the clipboard to save any changes.
Macros
You can add macros to your queries to simplify the syntax and enable dynamic elements, such as date range filters.
Grafana expands macros into native PostgreSQL SQL before executing the query. When the TimescaleDB extension is enabled, $__timeGroup and $__timeGroupAlias use time_bucket() for more efficient grouping.
Time-series macros
UNIX epoch macros
Interval variables
In addition to the macros listed, the following Grafana interval variables are replaced before query execution:
You can set a lower bound for these variables with the Min time interval option in the data source configuration or the panel’s query options.
Macro behavior
Keep the following behavior in mind when using macros:
- Comment stripping: Grafana strips SQL comments (
--line comments and/* */block comments) before expanding macros. Macros placed inside comments aren’t expanded. - TimescaleDB mode: When the TimescaleDB toggle is enabled in the data source configuration,
$__timeGroupand$__timeGroupAliasuse PostgreSQL’stime_bucket()function instead offloor(extract(epoch ...)). - Trailing comma pattern: A
$__timeGroup(...)call followed immediately by a comma (,) is automatically treated as$__timeGroupAlias(...), adding theAS "time"alias. This is a legacy convenience—use$__timeGroupAliasexplicitly for clarity. - Inspect expanded SQL: To view the final SQL after macro expansion, open the Query inspector in a panel and check the query that was sent to the database.
Table queries
If the Format option is set to Table, you can execute virtually any type of SQL query. The Table panel automatically displays the resulting columns and rows from your query.
You can change or customize the name of a Table panel column by using the SQL keyword AS syntax.
SELECT
  title as "Title",
  "user".login as "Created By",
  dashboard.created as "Created On"
FROM dashboard
INNER JOIN "user" on "user".id = dashboard.created_by
WHERE $__timeFilter(dashboard.created)
You can use
template variables in queries to create dynamic, reusable dashboards. For example, to filter by a variable named hostname:
SELECT
  $__time("time_date_time"),
  value_double AS value,
  hostname
FROM test_data
WHERE
  $__timeFilter("time_date_time")
  AND hostname IN($hostname)
ORDER BY time
For more information on creating and using template variables with PostgreSQL, refer to PostgreSQL template variables.
Table query with time range columns
Table format queries support a timeend column in addition to the time column. When both are present, Grafana treats the row as a time range rather than a single point. This is useful for displaying events with duration, such as maintenance windows or deployments.
SELECT
  start_time AS "time",
  end_time AS "timeend",
  description,
  status
FROM maintenance_windows
WHERE $__timeFilter(start_time)
Time series queries
Set the Format option to Time series to create and run time series queries.
Note
To run a time series query you must include a column named
timethat returns either a SQLdatetimevalue or a numeric datatype representing the UNIX epoch time in seconds. Additionally, the query results must be sorted by thetimecolumn for proper visualization in panels.
The examples in this section refer to the data in the following table:
+---------------------+--------------+---------------------+----------+
| time_date_time      | value_double | CreatedAt           | hostname |
+---------------------+--------------+---------------------+----------+
| 2020-01-02 03:05:00 | 3.0          | 2020-01-02 03:05:00 | 10.0.1.1 |
| 2020-01-02 03:06:00 | 4.0          | 2020-01-02 03:06:00 | 10.0.1.2 |
| 2020-01-02 03:10:00 | 6.0          | 2020-01-02 03:10:00 | 10.0.1.1 |
| 2020-01-02 03:11:00 | 7.0          | 2020-01-02 03:11:00 | 10.0.1.2 |
| 2020-01-02 03:20:00 | 5.0          | 2020-01-02 03:20:00 | 10.0.1.2 |
+---------------------+--------------+---------------------+----------+
Time series query results are returned in wide data frame format. In the data frame query result, any column, except for time or string-type columns, transforms into value fields. String columns become field labels.
Metric column detection
The PostgreSQL plugin identifies string-type columns (text, varchar, char, bpchar) as label columns that split the result into multiple series. Numeric and time columns become value fields.
Note
For backward compatibility, an exception to this rule applies to queries that return three columns, one of which is a string column named
metric. Instead of converting the metric column into field labels, it’s used as the field name, while the series name is set to its value. Refer to the following example.
Fill missing time series points
When using $__timeGroup or $__unixEpochGroup with a fill parameter (the third argument), Grafana fills gaps in your time series data. This is useful when your data has irregular intervals or missing data points. Fill only works with time series format queries.
The available fill modes are:
For example, $__timeGroupAlias("CreatedAt",'5m', 0) groups data into 5-minute intervals and fills any gaps with 0.
Row limits
Grafana applies a server-side row limit to query results to protect against excessive memory usage. If your query returns more rows than the limit, the result is truncated. To reduce the number of rows returned, narrow the dashboard time range, increase the $__timeGroup interval, or add a LIMIT clause to your query.
Example with metric column:
SELECT
  $__timeGroupAlias("time_date_time",'5m'),
  min("value_double"),
  'min' as metric
FROM test_data
WHERE $__timeFilter("time_date_time")
GROUP BY time
ORDER BY time
Data frame result:
+---------------------+-----------------+
| Name: time          | Name: min       |
| Labels:             | Labels:         |
| Type: []time.Time   | Type: []float64 |
+---------------------+-----------------+
| 2020-01-02 03:05:00 | 3               |
| 2020-01-02 03:10:00 | 6               |
+---------------------+-----------------+
To customize default series name formatting, refer to Standard options definitions.
Following are time series query examples.
Example with no grouping (raw points):
To return raw time and value points without grouping, use $__time to alias your date/time column as time:
SELECT
  $__time("time_date_time"),
  "value_double" as value
FROM test_data
WHERE $__timeFilter("time_date_time")
ORDER BY time
Example using the fill parameter in the $__timeGroupAlias macro to convert null values to zero:
SELECT
  $__timeGroupAlias("CreatedAt",'5m',0),
  sum(value) as value,
  hostname
FROM test_data
WHERE
  $__timeFilter("CreatedAt")
GROUP BY time, hostname
ORDER BY time
Based on the data frame result in the following example, the time series panel will generate two series named value 10.0.1.1 and value 10.0.1.2. To display the series names as 10.0.1.1 and 10.0.1.2, use the
Standard options definitions display value ${__field.labels.hostname}.
Data frame result:
+---------------------+---------------------------+---------------------------+
| Name: time          | Name: value               | Name: value               |
| Labels:             | Labels: hostname=10.0.1.1 | Labels: hostname=10.0.1.2 |
| Type: []time.Time   | Type: []float64           | Type: []float64           |
+---------------------+---------------------------+---------------------------+
| 2020-01-02 03:05:00 | 3                         | 4                         |
| 2020-01-02 03:10:00 | 6                         | 7                         |
+---------------------+---------------------------+---------------------------+
Example with multiple columns:
SELECT
  $__timeGroupAlias("time_date_time",'5m'),
  min("value_double") as "min_value",
  max("value_double") as "max_value"
FROM test_data
WHERE $__timeFilter("time_date_time")
GROUP BY time
ORDER BY time
Data frame result:
+---------------------+-----------------+-----------------+
| Name: time          | Name: min_value | Name: max_value |
| Labels:             | Labels:         | Labels:         |
| Type: []time.Time   | Type: []float64 | Type: []float64 |
+---------------------+-----------------+-----------------+
| 2020-01-02 03:04:00 | 3               | 4               |
| 2020-01-02 03:05:00 | 6               | 7               |
+---------------------+-----------------+-----------------+
Example with UNIX epoch time column:
When your time column stores UNIX epoch (seconds), use $__timeEpoch to alias it as time and $__unixEpochFilter in the WHERE clause:
SELECT
  $__timeEpoch(epoch_seconds_column),
  value_column as value
FROM my_table
WHERE $__unixEpochFilter(epoch_seconds_column)
ORDER BY time
For grouped time series with epoch columns, use $__unixEpochGroupAlias and $__unixEpochFilter. Refer to the Macros table for details.
EXPLAIN queries
You can run EXPLAIN and EXPLAIN ANALYZE queries in Code mode to inspect query execution plans. The results are returned as a table, which is useful for diagnosing slow queries directly within Grafana.
EXPLAIN ANALYZE
SELECT
  $__timeGroupAlias("time_date_time", '5m'),
  avg("value_double") AS value
FROM test_data
WHERE $__timeFilter("time_date_time")
GROUP BY time
ORDER BY time
Grafana macros are expanded before the query runs, so you can use $__timeFilter and other macros in your EXPLAIN queries to see the actual execution plan for the dashboard’s time range. Set the Format to Table to display the plan output.
Next steps
- Use template variables to create dynamic, reusable dashboards.
- Add annotations from PostgreSQL to overlay events on your panels.
- Set up alerting to get notified when metrics cross thresholds (time series format only).
- Troubleshoot issues if you encounter problems with queries.


