This is documentation for the next version of Grafana documentation. For the latest stable release, go to the latest version.
Dashboard URL variables
Dashboard URL variables allow you to provide more context when you share a dashboard URL.
For example, you could share a basic URL to your dashboard that looks like this:
https://${your-domain}/path/to/your/dashboardThis allows someone to navigate to the dashboard, but doesn’t provide any helpful context that might be available.
Instead, you can add dashboard variables, passed as query parameters in the dashboard URL, to provide a URL like this:
https://${your-domain}/path/to/your/dashboard?var-example=valueThis allows you to provide added context to the dashboard when someone navigates to it.
Variables as query parameters
Grafana interprets query string parameters prefixed with var- as variables in the given dashboard.
For example:
https://${your-domain}/path/to/your/dashboard?var-example=valueIn this URL, the query parameter var-example=value represents the dashboard variable example with a value of value.
Multiple values for a variable
To pass multiple values, repeat the variable parameter once for each value:
https://${your-domain}/path/to/your/dashboard?var-example=value1&var-example=value2Grafana interprets var-example=value1&var-example=value2 as the dashboard variable example with two values: value1 and value2.
Example
This dashboard in Grafana Play passes the variable server with multiple values, and the variables app and interval with a single value each.
Filters and group by dimensions
Filters automatically query your data source for available dimensions and lets users add or remove filters and group by dimensions on the dashboard dynamically. This allows you to quickly apply filters dashboard-wide to all metric queries that use the specified data source. The group by function allows you to then group data by keys, letting you split it up.
For more information, refer to Filter and Group by documentation.
To pass a filter as a query parameter, use the variable syntax to pass the filter. Then provide the key, operator, and value as a pipe-separated list.
For example:
https://${your-domain}/path/to/your/dashboard?var-filter=example_key|=|example_valueIn this URL, the query parameter var-filter=key|=|value applies the configured filter using the example_key key, the = operator, and the example_value value.
Note
When sharing URLs with filters, remember to encode the URL. In the preceding example, replace the pipes (
|) with%7Cand the equality operator (=) with%3D.
Example
This dashboard in Grafana Play passes the filter variable Filters with the filter value job = metrictank/tsdb-gw.
Time range control using the URL
You can control the time range of a dashboard by providing the following query parameters in the dashboard URL:
from- Defines the lower limit of the time range, specified in ms, epoch, or relative time.to- Defines the upper limit of the time range, specified in ms, epoch, or relative time.timeandtime.window- Defines a time range fromtime-time.window/2totime+time.window/2. Both parameters should be specified inms. For example?time=1500000000000&time.window=10000results in a 10-second time range from 1499999995000 to 1500000005000`.timezone- Defines the time zone. For exampletimezone=Europe/Madrid.
Since these aren’t variables, they don’t require the var- prefix.
The following example shows a dashboard with the time range of the last five minutes:
https://${your-domain}/path/to/your/dashboard?from=now-5m&to=nowVariables in dashboard links
When you create dashboard links the dashboard settings, you can have current dashboard variables included in the link by selecting that option:
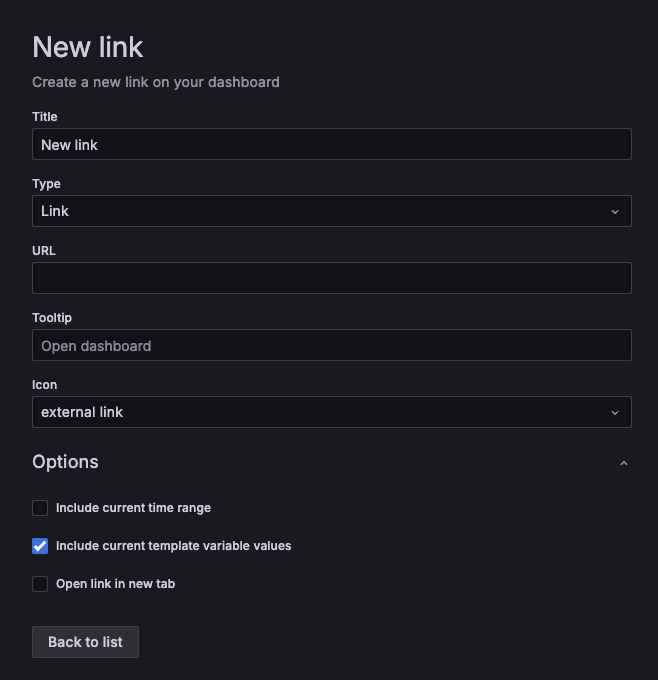
For steps to add variables to dashboard links, refer to Manage dashboard links.


