This is documentation for the next version of Grafana documentation. For the latest stable release, go to the latest version.
Query and transform data
Grafana supports many types of data sources. Data source queries return data that Grafana can transform and visualize. Each data source uses its own query language, and data source plugins each implement a query-building user interface called a query editor.
About queries
Grafana panels communicate with data sources using queries, which retrieve data for the visualization. A query is a question written in the query language used by the data source.
You can configure query frequency and data collection limits in the panel’s data source options. Grafana supports up to 26 queries per panel.
Note
You must be familiar with a data source’s query language. For more information, refer to Data sources.
Query editors
Note
The screenshots of the panel query editor on this page show the new query editing experience, currently in public preview. For information about the classic, generally available query editor, refer to the Grafana v13.0 documentation.
Grafana Labs offers limited support for public preview features, and breaking changes might occur prior to the feature being made generally available. To use this feature, enable the
queryEditorNextfeature toggle in your Grafana configuration file or contact Support.
Each data source’s query editor provides a customized user interface that helps you write queries that take advantage of its unique capabilities.
Because of the differences between query languages, each data source query editor looks and functions differently. Depending on your data source, the query editor might provide auto-completion features, metric names, variable suggestions, or a visual query-building interface.
For details on a specific data source’s unique query editor features, refer to its documentation:
- For data sources included with Grafana, refer to Built-in core data sources, which links to each core data source’s documentation.
- For data sources installed as plugins, refer to the documentation for the plugin.
- Data source plugins in the Grafana plugin catalog link to or include their documentation in their catalog listings. For details about the plugin catalog, refer to Plugin management.
- For links to Grafana Enterprise data source plugin documentation, refer to the Enterprise plugins index.
Query syntax
Each data source uses a different query languages to request data. For details on a specific data source’s unique query language, refer to its documentation.
PostgreSQL example:
SELECT hostname FROM host WHERE region IN($region)PromQL example:
query_result(max_over_time(<metric>[${__range_s}s]) != <state>)Special data sources
Grafana also includes three special data sources: Grafana, Mixed, and Dashboard. For details, refer to Data sources
Saved queries
Note
Saved queries is only available on Grafana Enterprise and Grafana Cloud.
You can save queries that you’ve created so they can be reused by you and others in your organization. This helps users across your organization create dashboards without having to create their own queries or know a query language. It also helps you avoid having several users build the same queries for the same data sources multiple times.
Saved queries are supported in:
Learn more about saved queries:
- Saved queries dialog box
- Roles, permission, and RBAC
- How to save a query
- Variables in saved queries
- Manage saved queries as code
- Known limitations
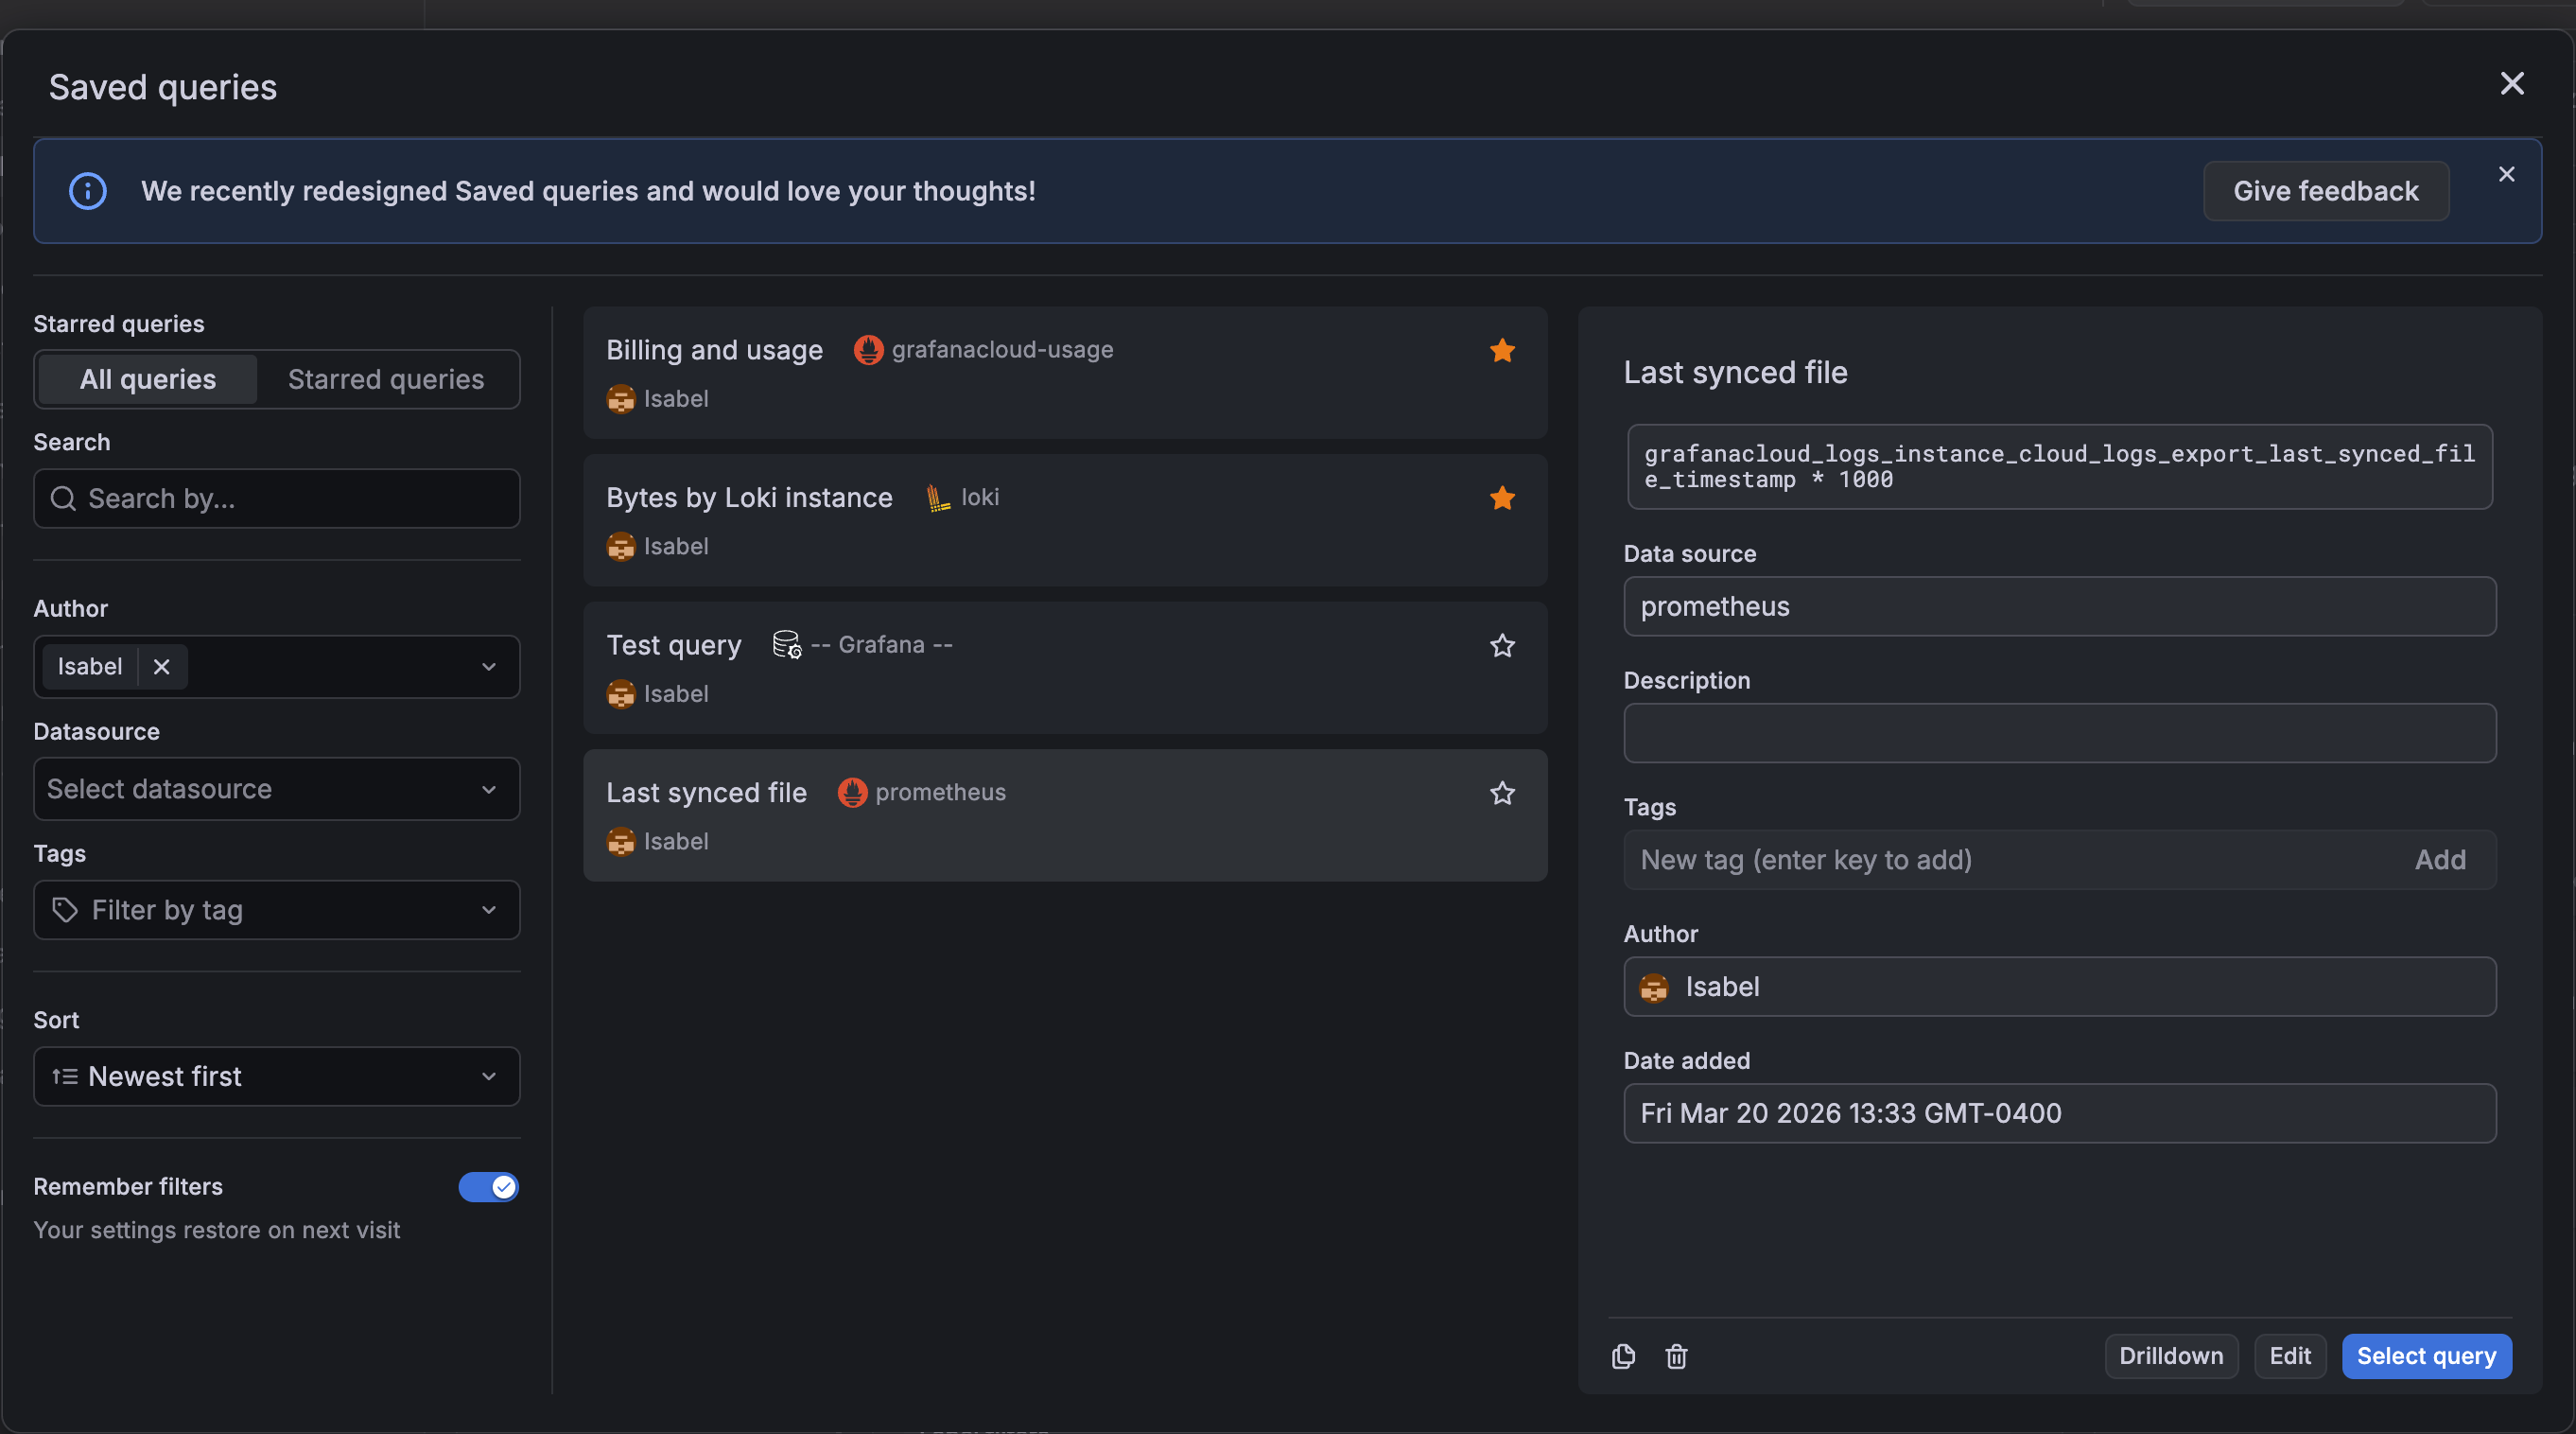
Saved queries dialog box
The Saved queries dialog box gives you access to all the saved queries in your organization:
To access saved queries:
- Click Replace in the query editor pane.
- Click the blue plus sign in the query editor sidebar and select Add saved query.
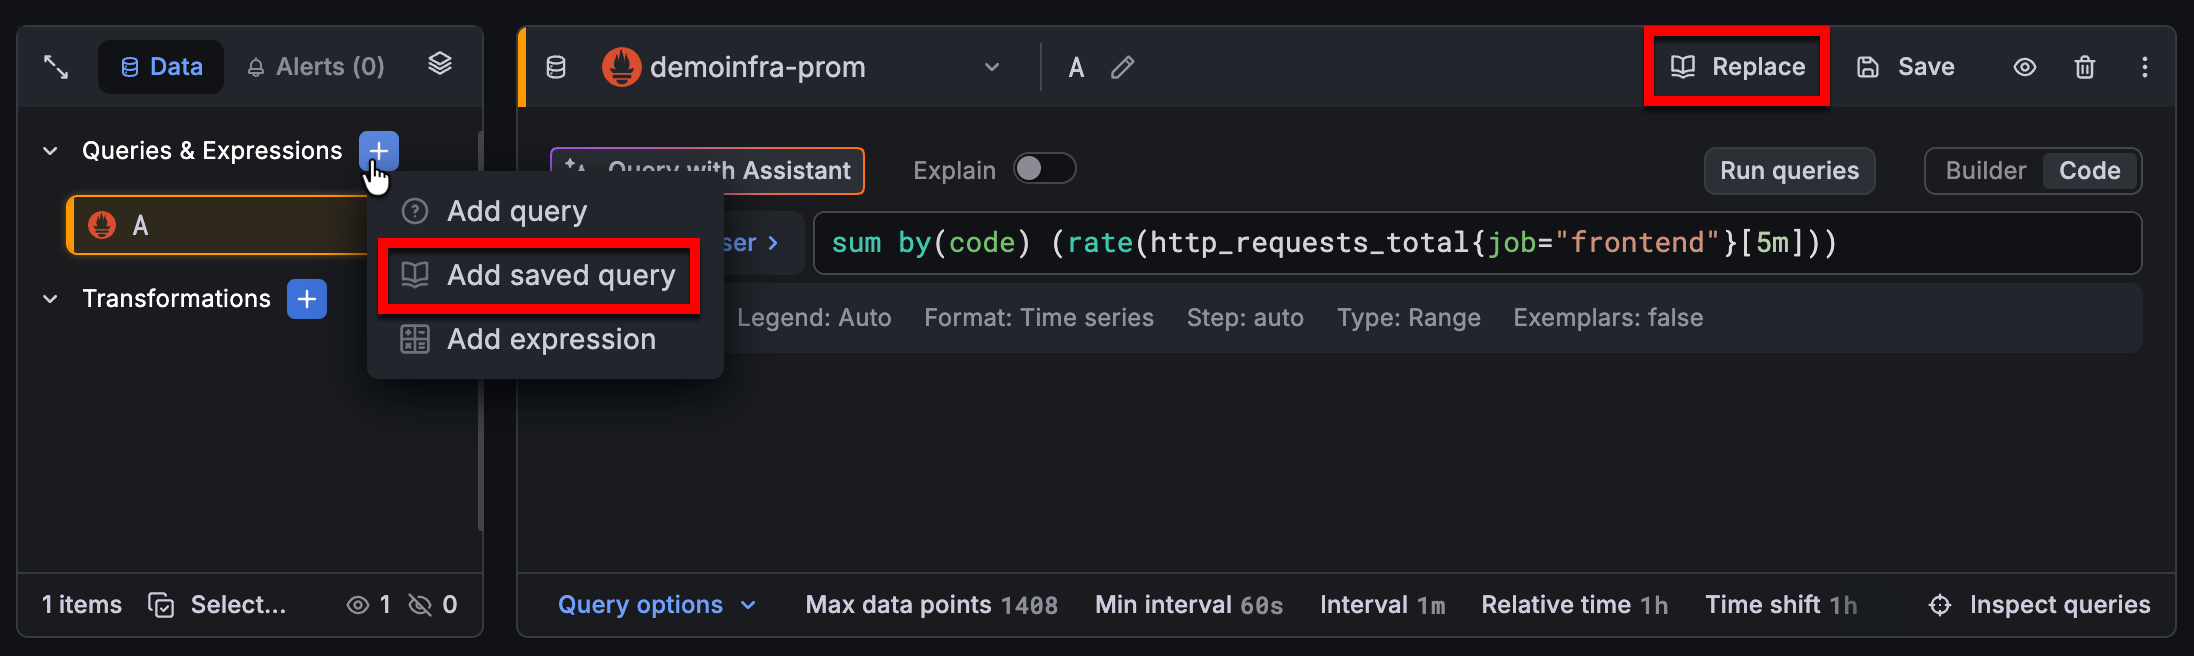
Clicking Add saved query adds an additional query, while clicking Replace updates your configured query.
Note
To review your saved queries, press
Ctrl + KorCmd + Kto open the command palette and search “Saved queries”. From this view, you can also select a query to open in Explore.
From the Saved queries dialog box, you can:
- Search for queries by data source name, query content, title, or description.
- Sort queries alphabetically or by creation date.
- Filter by data source name, author name, and tags. The tag filter uses the
ORoperator, while the others use theANDoperator. Use the Remember filters switch to persist your filter selections across sessions in your local storage. - Star queries so that they appear in the Starred queries filter view.
- Duplicate or delete a saved query.
- Edit a query title, description, or tags.
You can apply all the same search, filter, and sort options in the Starred queries filter view.
Tip
When you select a query with a Loki, Mimir, Tempo, or Pyroscope data source, the Saved queries dialog box displays a Drilldown button. Click the button to open the associated Drilldown app, while maintaining the context of the query. Learn more about these apps in the Drilldown documentation.
Roles, permissions, and RBAC
Saved queries support role-based access controls. By default, saved queries have two RBAC roles:
- Writer: Create, update, and delete all saved queries.
- Reader: Reuse saved queries.
If you used saved queries prior to the addition of RBAC support in Grafana v12.4, Grafana user roles are mapped as follows:
- Admin > Writer
- Editor > Writer
- Viewer > Reader
Save a query
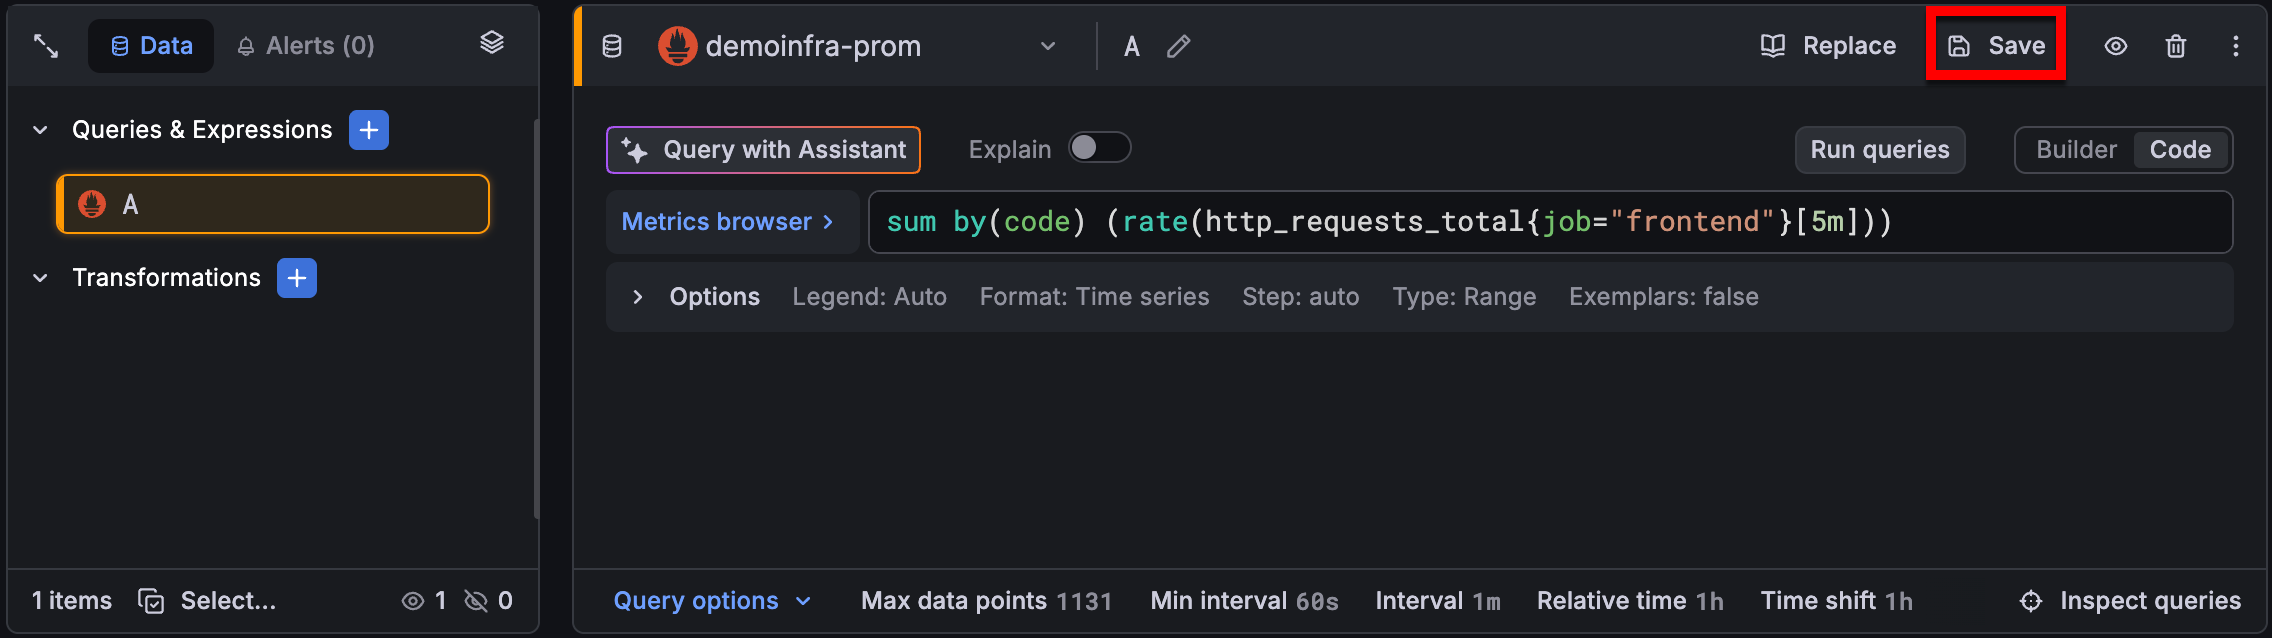
To save a query you’ve created:
From the query editor, click the Save:
![Save a query]()
In the Saved queries dialog box, enter a title for the query that makes it easier to find later.
(Optional) Enter a description and relevant tags.
Click Save.
Variables in saved queries
If a saved query includes variables, you can substitute the variables in the query without modifying it. This is useful in environments where variable names or available values differ between dashboards.
You can map the original variables to either:
- A variable in your dashboard
- A custom value that you enter
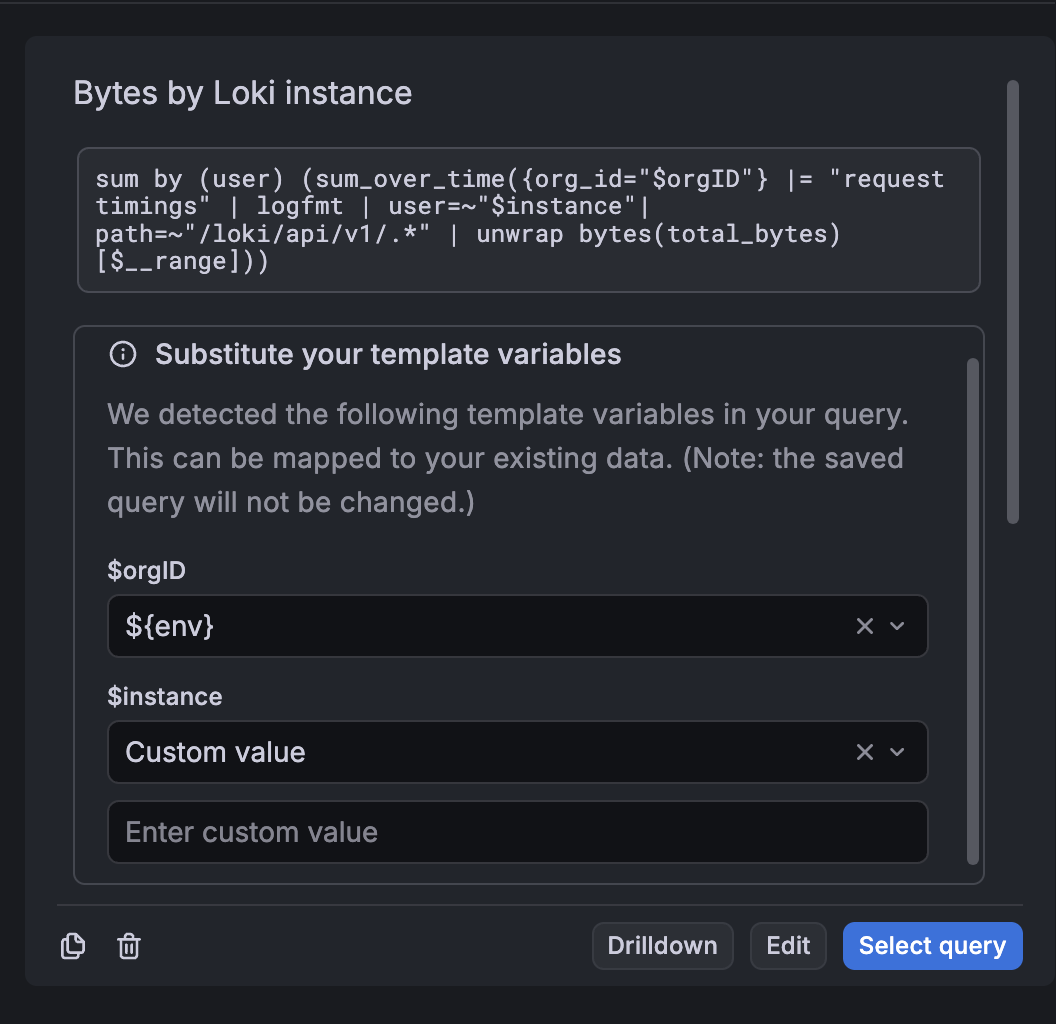
Grafana applies your selections to the query before inserting it into the dashboard. However, the substitutions only apply to the query when it’s reused, and the original saved query remains unchanged.
Manage saved queries as code
You can manage saved queries as code with the Grafana Terraform provider, which lets you version-control your query library and keep it consistent across instances. For more information, refer to Manage saved queries using Terraform.
Known limitations
- No validation is performed when you save a query, so it’s possible to save an invalid query. You should confirm the query is working properly before you save it.
- You can save a maximum of 1000 queries.
Navigate the query editor
Note
The screenshots of the panel query editor on this page reflect the new query editing experience, currently in public preview. For information about the classic, generally available query editor, refer to the Grafana v13.0 documentation.
Grafana Labs offers limited support for public preview features, and breaking changes might occur prior to the feature being made generally available. To use this feature, enable the
queryEditorNextfeature toggle in your Grafana configuration file or contact Support.
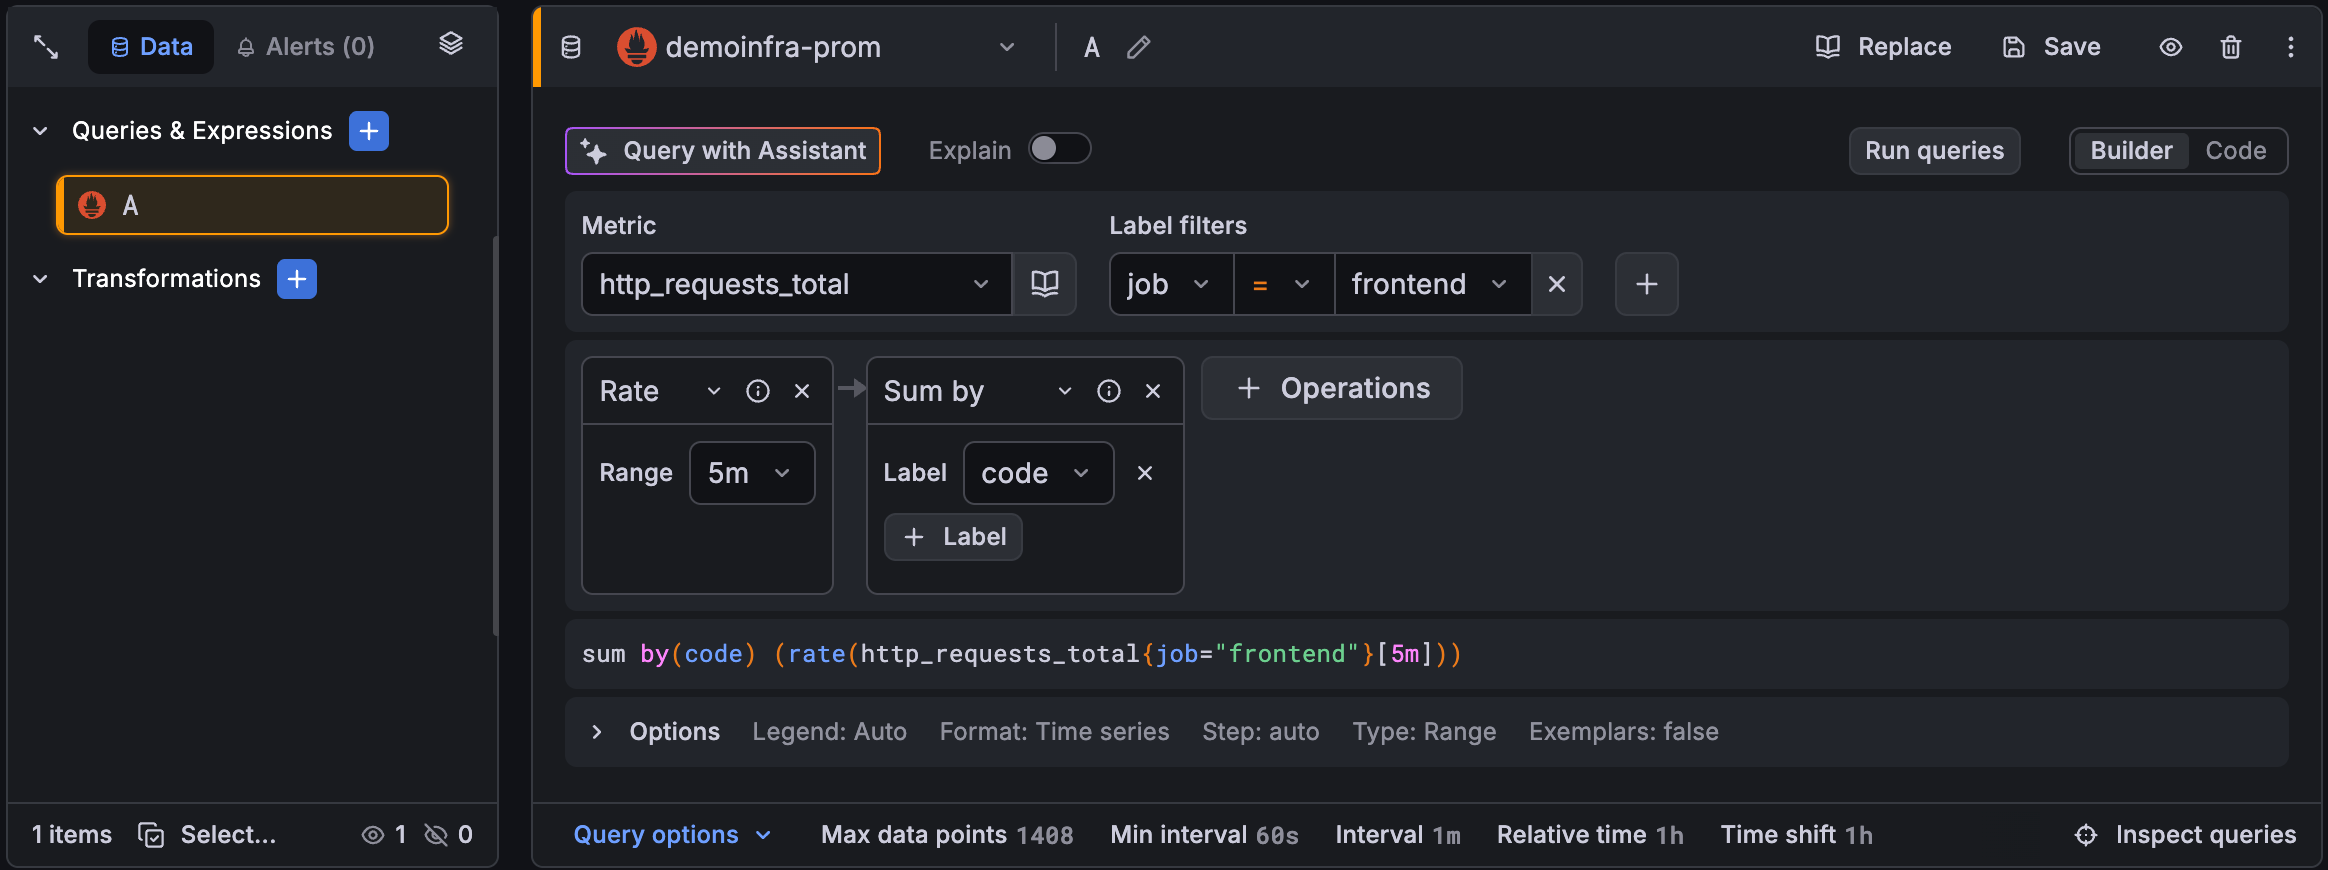
A panel’s query editor has the following elements. Hover your cursor over a number to display information about the query editor element.
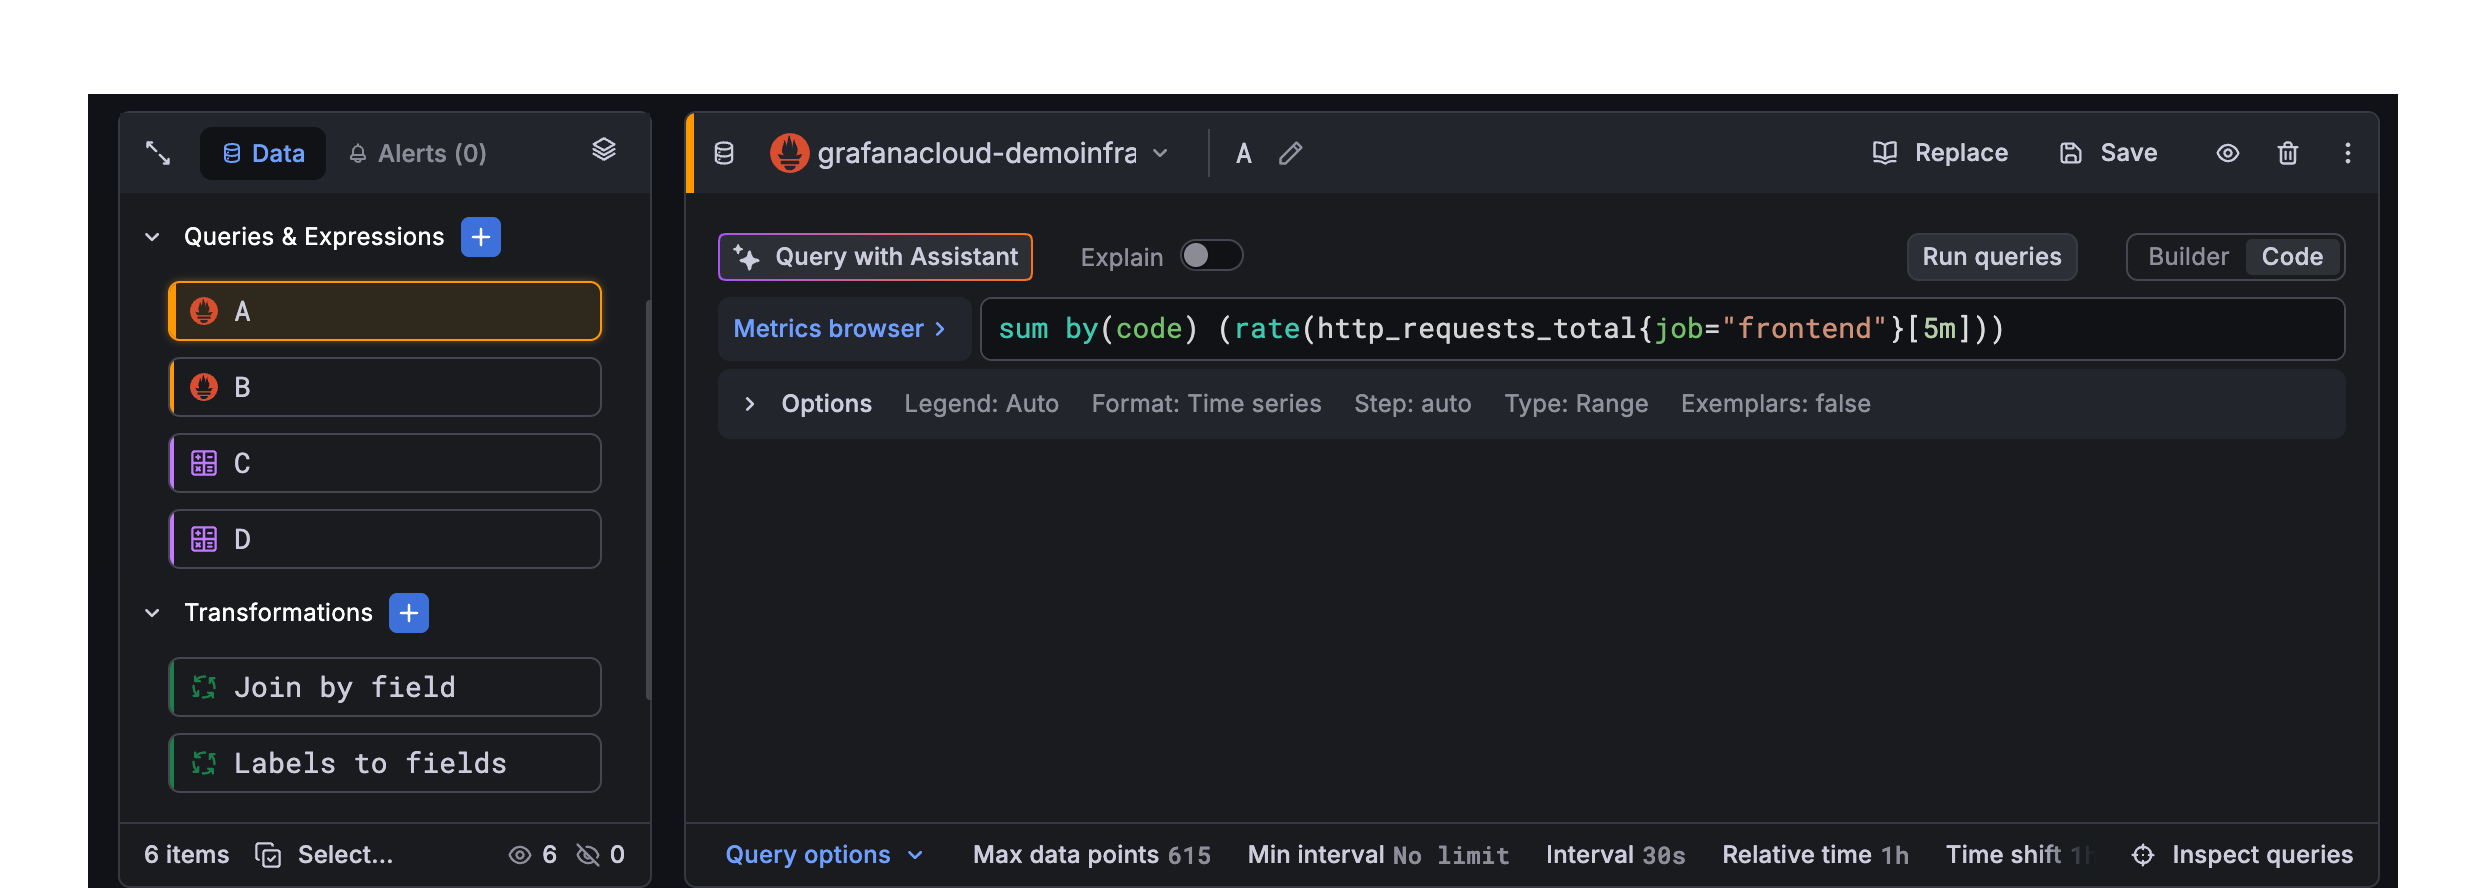
Sidebar
The sidebar displays queries, expressions, and transformations as color-coded cards with visual indicators for state, like error, hidden, and disabled, while a footer tracks your total item count.
Data/Alerts buttons
Click the buttons to move between data pipeline and related alerts. In Alerts, you have the option to start creating a alert rule.
Stacked view icon
The stacked view displays all of your queries, expressions, and transformations in a single list in the editor pane.
Multi-select
Click Select… in the sidebar footer to enter multi-select mode, then check the items you want to work with so you can take bulk actions. You can also press the
Shiftkey while you click to select a range. If all items in your selection are queries, you can change the data source for all of them at once.Queries & expressions
The list of queries and expressions you’ve written. Click a card in the sidebar to display that query or expression in the editor pane on the right. Click the blue plus sign to add a new query, add a saved query, or an expression. For more information about expressions, refer to Use expressions to manipulate data.
Transformations
The list of all the transformations you’ve added. Click the blue plus sign to add a new transformation.
- Editor pane
Data source selector
Select the data source to query. For more information about data sources, refer to Data sources.
Query name editor
The workspace for creating and configuring queries, expressions, and transformations. It displays the selected item from the sidebar and provides controls to edit configuration, switch between available editing modes, configuring options, and running queries to inspect results.
Builder/Code modes
Click the button to switch between builder and code editor modes when creating queries for some data sources.
Query options
Click Query options in the footer of the editor pane to access options set maximum data retrieval parameters and query execution time intervals.
Query inspector button
Click Query inspector in the footer of the editor pane to open the query inspector panel, where you can view and optimize your query.
Grafana organizes queries, expressions, and transformations into rows, each with its own card and editor pane. Queries and expressions are identified with a letter (A, B, C, and so on) by default.
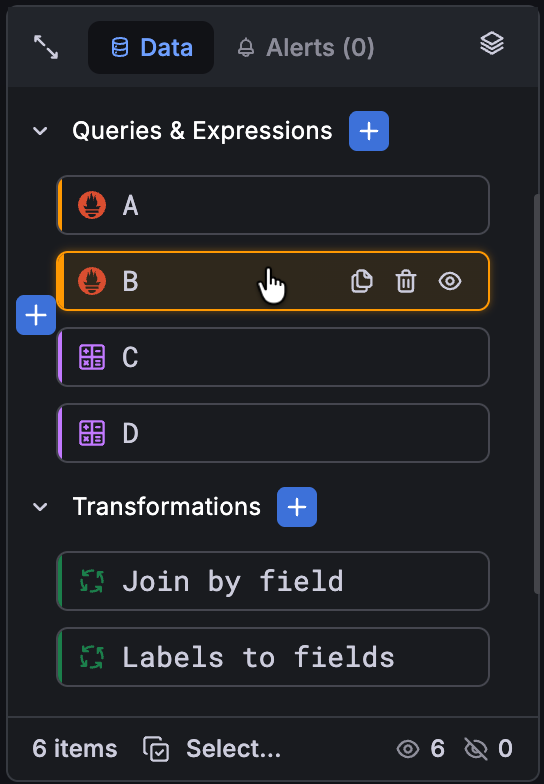
You can also rearrange the order of elements by dragging and dropping the cards in the list.
When you hover your cursor over the cards, a blue plus sign appears beside the card. You can use that to add queries, expressions, or transformations in that position. Hovering your cursor over a card also displays duplicate, hide, and delete actions for a specific data element:
For pipelines with many queries, expressions, or transformations, you can expand the sidebar to full height to see everything at once:
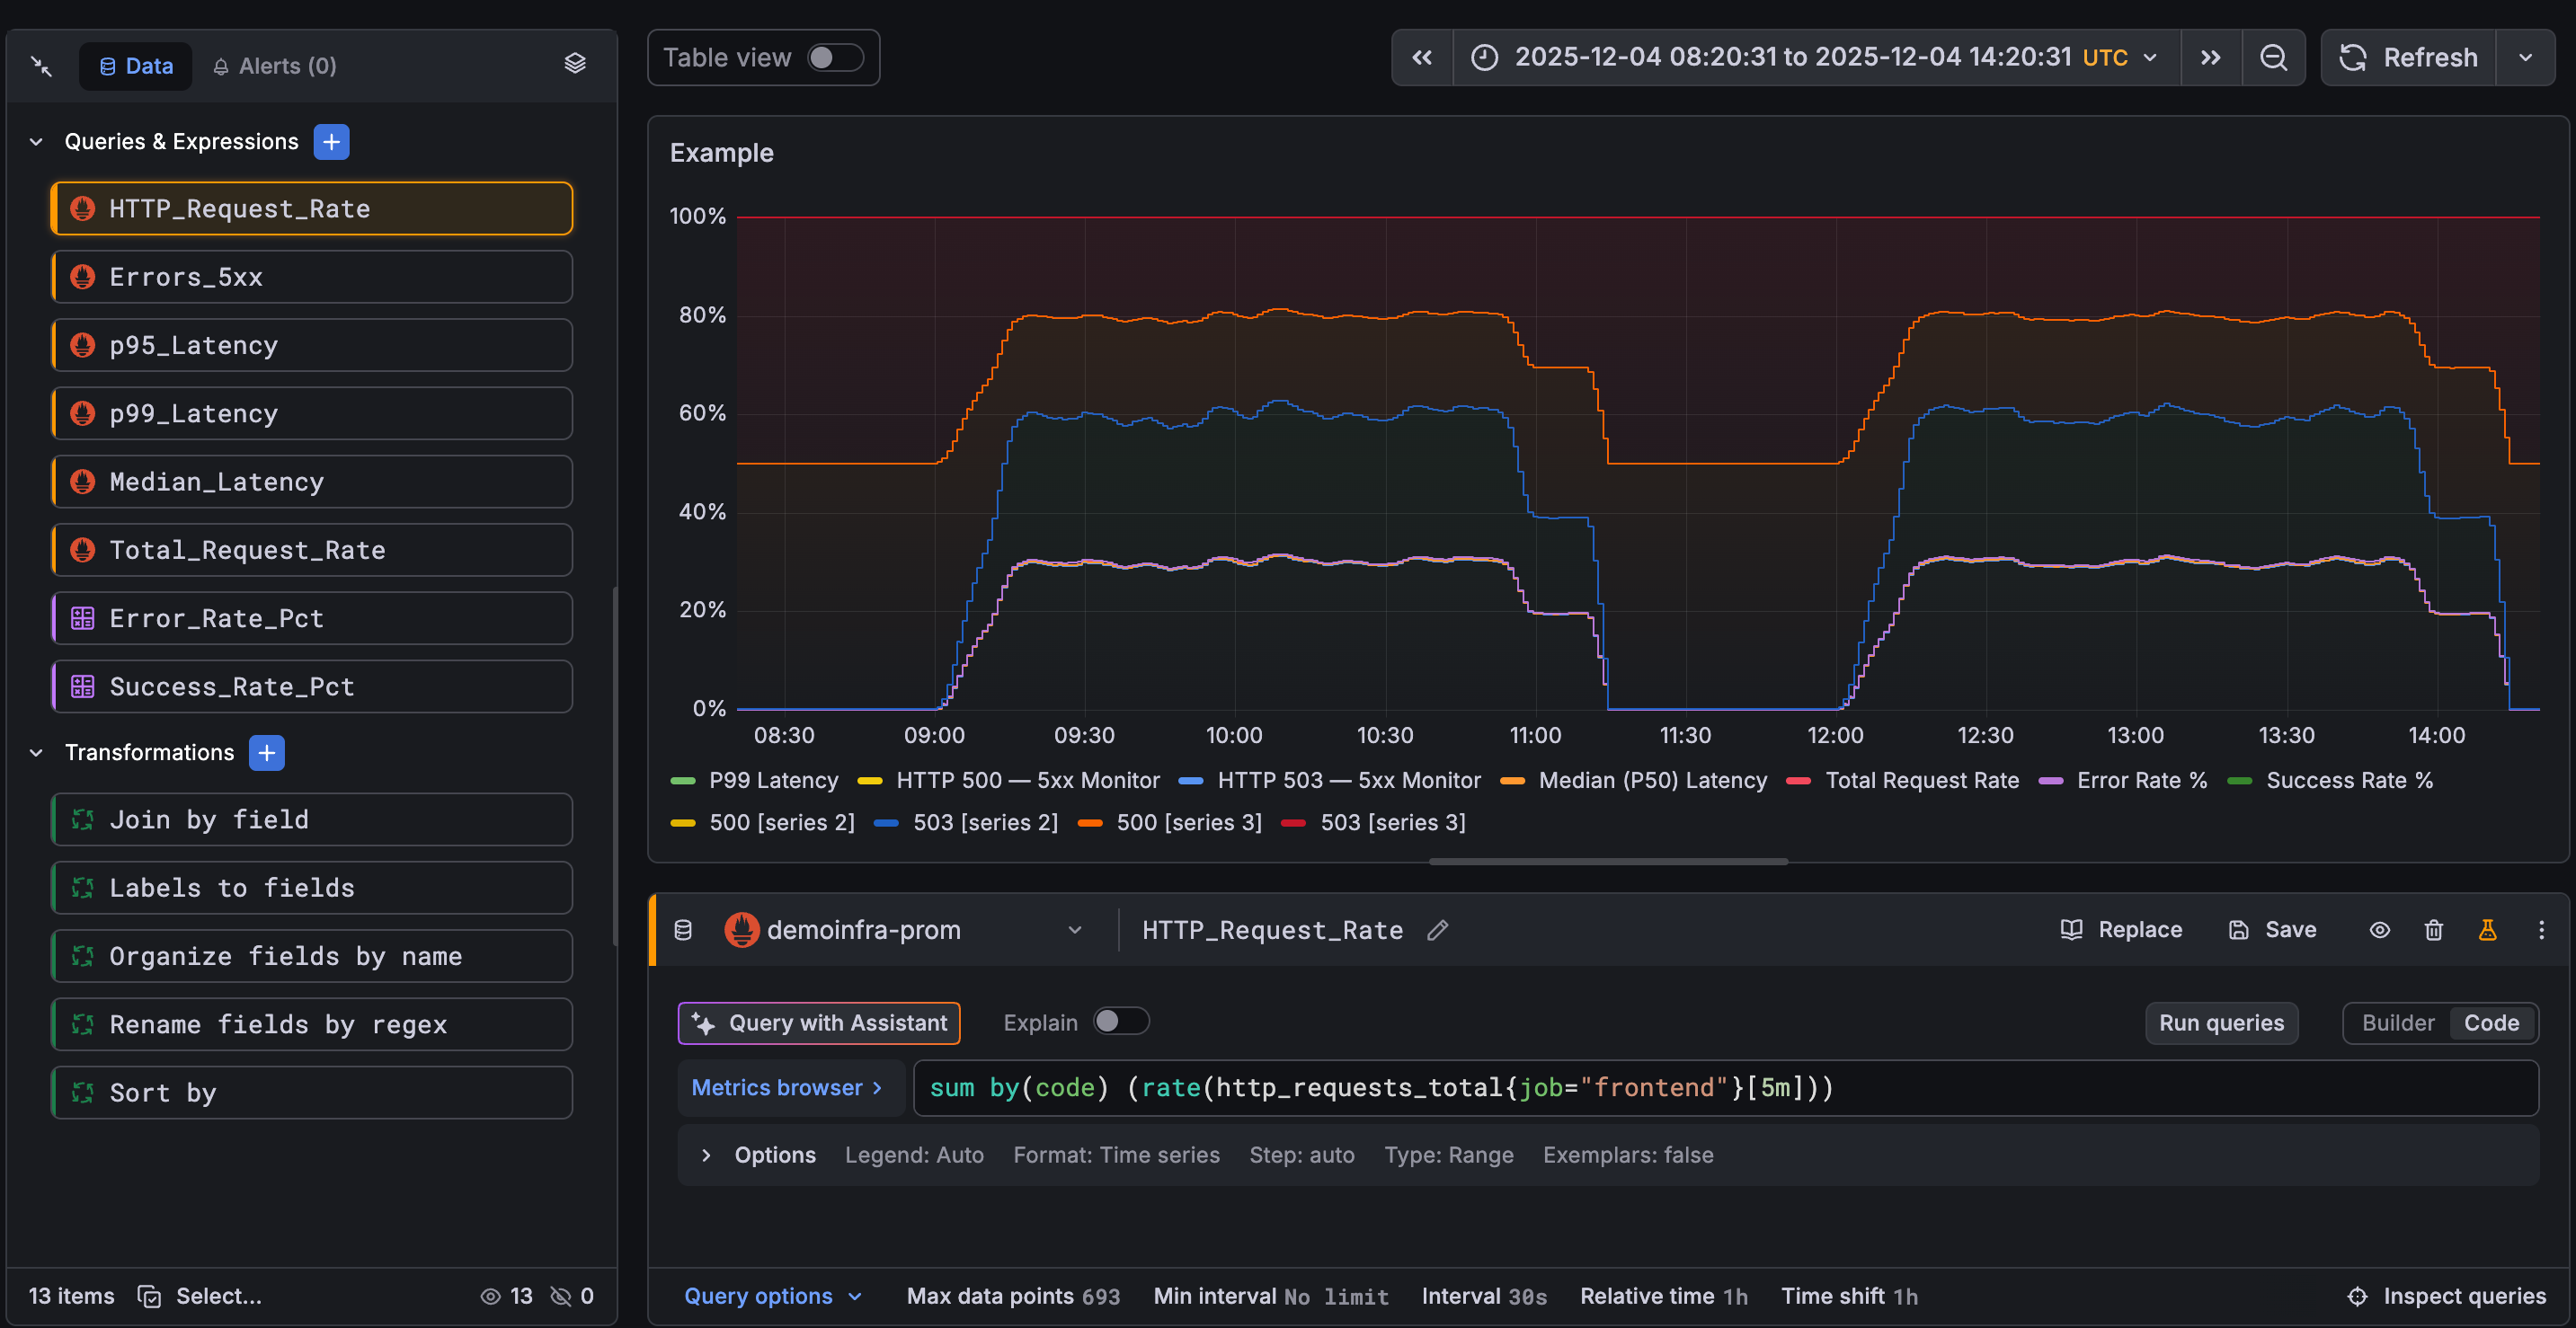
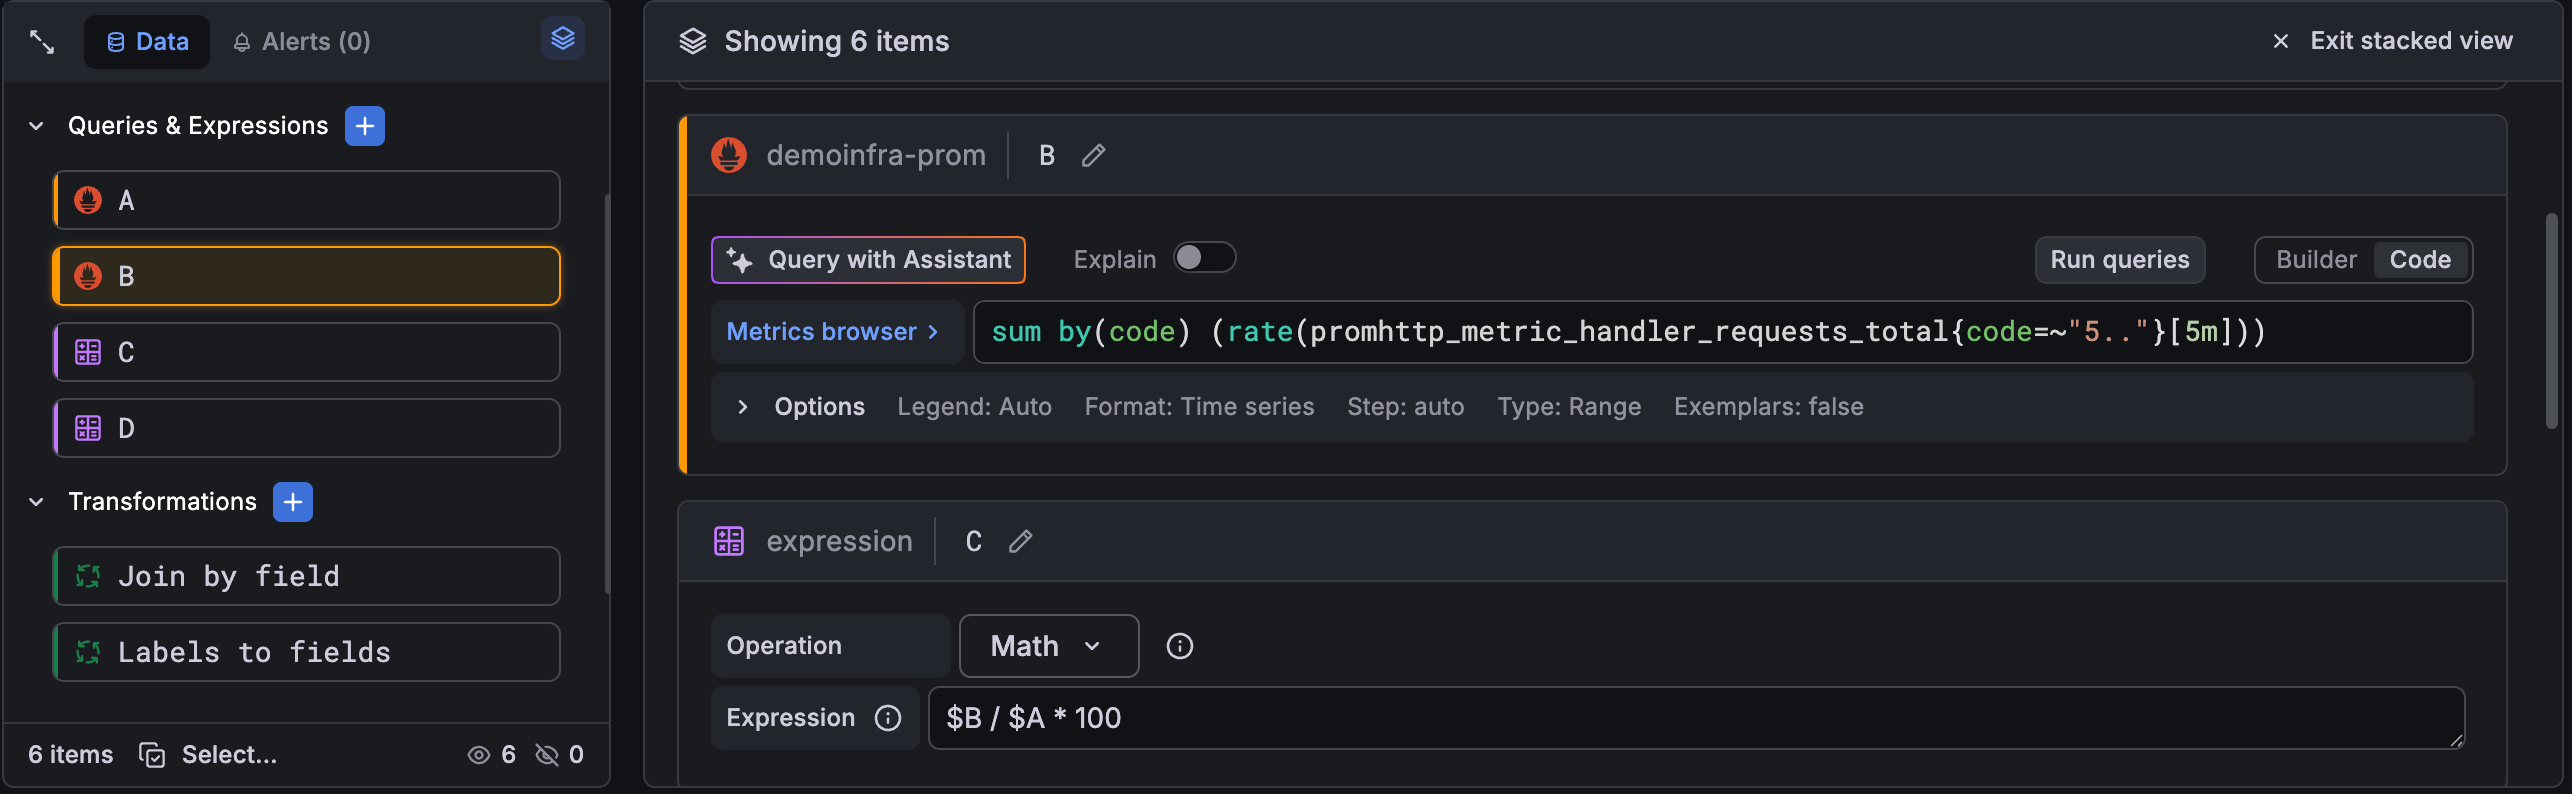
You can also use the stacked view to see all of the data elements at once in the editor pane. In this view, when you click a card, it takes you to the corresponding element:
Add a query
A query returns data that Grafana visualizes in dashboard panels. When you create a panel, Grafana automatically selects the default data source.
To add a query to a panel, follow these steps:
Hover the cursor over any part of the panel to which you’re adding a query and click Configure visualization.
The panel opens in edit mode with a first query card added and selected in the query editor pane.
In the editor pane, click the Data source drop-down menu and select a data source.
If you’re creating a new dashboard, you’ll be prompted to select a data source when you add the first panel.
Click Query options to configure the maximum number of data points you need.
For more information about query options, refer to Query options.
To create a query, do one of the following:
- Write or construct a query in the query language of your data source.
- Click Replace to reuse a saved query.
Note
Saved queries is only available on Grafana Enterprise and Grafana Cloud.
(Optional) To save the query for reuse, click the Save in the editor pane.
(Optional) In the sidebar, click the blue plus sign next to Queries & Expressions and select Add query or Add saved query to add more queries as needed.
Click Run queries in the editor pane.
Grafana queries the data source and visualizes the data.
Manage queries
The following table describes actions you can take for each query:
| Icon | Description |
|---|---|
| Replace the configured query with a saved query. For more information, refer to Saved queries (Enterprise and Cloud only). | |
| Save query. Saves the query so it can be reused. Access saved queries by clicking Replace. For more information, refer to Saved queries (Enterprise and Cloud only). | |
| Create recorded queries so you can see trends over time by taking a snapshot of a data point on a set interval (Enterprise and Cloud only). | |
| Hides a query. Grafana does not send hidden queries to the data source. | |
| Removes a query. Removing a query permanently deletes it, but sometimes you can recover deleted queries by reverting to previously saved versions of the panel. | |
| Copies a query. Duplicating queries is useful when working with multiple complex queries that are similar and you want to either experiment with different variants or do minor alterations. Click the More query actions menu to access this option. | |
 | Toggles query editor help. If supported by the data source, click this icon to display information on how to use the query editor or provide quick access to common queries. Click the More query actions menu to access this option. |
Query options
Click Query options in the footer of the editor pane to see settings for the selected data source. Changes you make here affect only queries made in this panel.
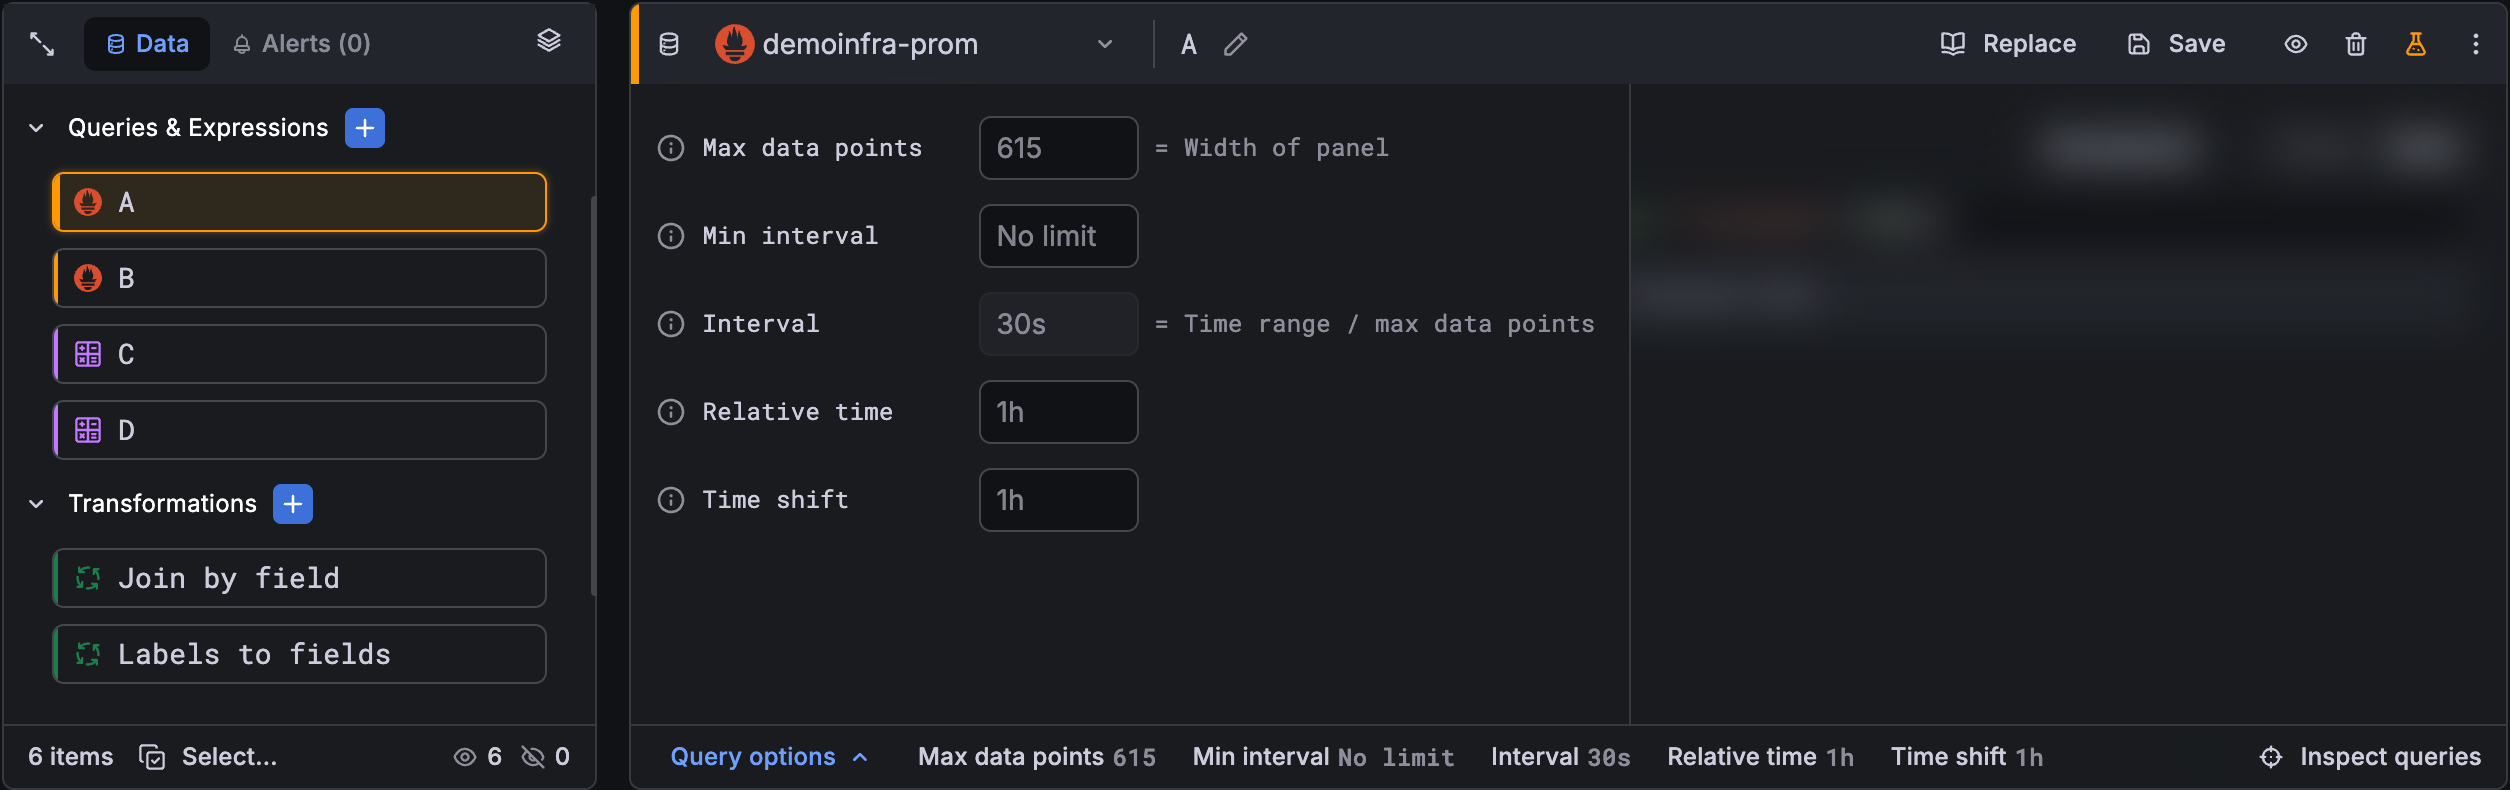
Grafana sets defaults that are shown in dark gray text. Changes are displayed in white text. To return a field to the default setting, delete the white text from the field.
Max data points
If the data source supports it, this sets the maximum number of data points for each series returned. If the query returns more data points than the max data points setting, then the data source reduces the number of points returned by aggregating them together by average, max, or another function.
You can limit the number of points to improve query performance or smooth the visualized line. The default value is the width (or number of pixels) of the graph, because you can only visualize as many data points as the graph panel has room to display.
Because the default depends on the panel’s pixel width, the same dashboard can show a different visual representation of the data depending on the panel’s size on screen.
When you open a panel by clicking View in the panel menu, or by pressing v, the panel expands to fill the window.
This doesn’t change the dashboard’s grid layout, but it gives the panel more pixels to render with.
With more pixels, Grafana can request more data points, which increases the resolution and reduces the step size between points.
As a result, the same query can return a more detailed series in view mode than in the dashboard grid.
To get a consistent visual representation in both views, set Max data points to a fixed value.
For example, if you set it to 100, Grafana requests no more than 100 points, regardless of the panel’s pixel width.
This means the query resolution remains more consistent whether the panel is in the dashboard grid or in view mode.
Note
Max data points defaults to the panel’s pixel width, so resizing a panel changes how many points the data source returns. This affects not only the visual resolution, but also any values calculated from that data, such as transformations, reducer calculations (the Calculation option in visualizations like Stat, Gauge, and Bar gauge), and expressions. If a panel’s computed value shifts with its size, set Max data points to a fixed value, or set Min interval to stabilize the resolution.
With streaming data, Grafana uses the max data points value for the rolling buffer. Streaming is a continuous flow of data, and buffering divides the stream into chunks. For example, Loki streams data in its live tailing mode.
Min interval
Sets a minimum limit for the automatically calculated interval, which is typically the minimum scrape interval. If a data point is saved every 15 seconds, you don’t benefit from having an interval lower than that. You can also set this to a higher minimum than the scrape interval to retrieve queries that are more coarse-grained and well-functioning.
Note
The Min interval corresponds to the min step in Prometheus. Changing the Prometheus interval can change the start and end of the query range because Prometheus aligns the range to the interval. Refer to Min step for more details.
Interval
Sets a time span that you can use when aggregating or grouping data points by time.
Grafana automatically calculates an appropriate interval that you can use as a variable in templated queries.
The variable is measured in either seconds ($__interval) or milliseconds ($__interval_ms).
Intervals are typically used in aggregation functions like sum or average.
For example, this is a Prometheus query that uses the interval variable: rate(http_requests_total[$__interval]).
This automatic interval is calculated based on the width of the graph. As the user zooms out on a visualization, the interval grows, resulting in a more coarse-grained aggregation. Likewise, if the user zooms in, the interval decreases, resulting in a more fine-grained aggregation.
For more information, refer to Global variables.
Relative time
Overrides the relative time range for individual panels, which causes them to be different than what is selected in the dashboard time picker in the top-right corner of the dashboard. You can use this to show metrics from different time periods or days on the same dashboard.
Note
Panel time overrides have no effect when the dashboard’s time range is absolute.
With Grafana Play, you can explore and see how it works, learning from practical examples to accelerate your development. This feature can be seen on Time range override.
Time shift
Overrides the time range for individual panels by shifting its start and end relative to the time picker. For example, you can shift the time range for the panel to be two hours earlier than the dashboard time picker.
Note
Panel time overrides have no effect when the dashboard’s time range is absolute.
Caution
Avoid using bare month offsets such as
1Mwithout a rounding suffix. Because calendar months vary in length, a plain1Mshift can produce inconsistent results. For example, shifting from a 30-day month might truncate the end date unexpectedly.Use
1M/Minstead to snap the shifted range to true calendar month boundaries. The/Msuffix rounds the start and end of the shifted range down to the beginning of the month, ensuring consistent behavior regardless of the current month’s length.
Cache timeout
This option is visible only if it’s available in the data source. It overrides the default cache timeout if your time series store has a query cache. Specify this value as a numeric value in seconds.


