
This is documentation for the next version of Grafana documentation. For the latest stable release, go to the latest version.

Elasticsearch query editor
Grafana provides a query editor for Elasticsearch. Elasticsearch queries are in Lucene format. For more information about query syntax, refer to Lucene query syntax and Query string syntax.
Note
When composing Lucene queries, ensure that you use uppercase boolean operators:
AND,OR, andNOT. Lowercase versions of these operators are not supported by the Lucene query syntax.

For general documentation on querying data sources in Grafana, including options and functions common to all query editors, refer to Query and transform data.
Aggregation types
Elasticsearch groups aggregations into three categories:
Bucket - Bucket aggregations don’t calculate metrics, they create buckets of documents based on field values, ranges and a variety of other criteria. Refer to Bucket aggregations for additional information. Use bucket aggregations under
Group bywhen creating a metrics query in the query builder.Metrics - Metrics aggregations perform calculations such as sum, average, min, etc. They can be single-value or multi-value. Refer to Metrics aggregations for additional information. Use metrics aggregations in the metrics query type in the query builder.
Pipeline - Pipeline aggregations work on the output of other aggregations rather than on documents or fields. Refer to Pipeline aggregations for additional information.
Select a query type
There are two types of queries you can create with the Elasticsearch query builder. Each type is explained in detail below.
Use the Preserve query toggle to keep your Lucene query when you switch between Metrics, Logs, Raw Data, and Raw Document. When the toggle is off (the default for new queries), switching query types clears the Lucene query. Grafana remembers your last Preserve query choice in the browser for new queries.
Metrics query type
Metrics queries aggregate data and produce calculations such as count, min, max, and more. Click the metric box to view options in the drop-down menu. The default is count.
Alias - Aliasing only applies to time series queries, where the last group is
date histogram. This is ignored for any other type of query.Metric - Metrics aggregations include:
- count - refer to Value count aggregation
- average - refer to Avg aggregation
- sum - refer to Sum aggregation
- max - refer to Max aggregation
- min - refer to Min aggregation
- extended stats - refer to Extended stats aggregation
- percentiles - refer to Percentiles aggregation
- unique count - refer to Cardinality aggregation
- top metrics - refer to Top metrics aggregation
- rate - refer to Rate aggregation
Sibling bucket aggregations - These metrics compute an outer statistic over a per-group inner statistic within each time bucket. For example, Sum Bucket with an inner Max produces a sum of maxima across hosts. The following options are available:
- Sum Bucket - refer to Sum bucket aggregation
- Max Bucket - refer to Max bucket aggregation
- Min Bucket - refer to Min bucket aggregation
- Average Bucket - refer to Avg bucket aggregation
Pipeline aggregations - Pipeline aggregations work on the output of other aggregations rather than on documents. The following pipeline aggregations are available:
- moving function - Calculates a value based on a sliding window of aggregated values. Refer to Moving function aggregation.
- derivative - Calculates the derivative of a metric. Refer to Derivative aggregation.
- cumulative sum - Calculates the cumulative sum of a metric. Refer to Cumulative sum aggregation.
- serial difference - Calculates the difference between values in a time series. Refer to Serial differencing aggregation.
- bucket script - Executes a script on metric values from other aggregations. Refer to Bucket script aggregation.
You can select multiple metrics and group by multiple terms or filters when using the Elasticsearch query editor.
Use the + sign to the right to add multiple metrics to your query. Click on the eye icon next to Metric to hide metrics, and the garbage can icon to remove metrics.
- Group by options - Create multiple group by options when constructing your Elasticsearch query. Date histogram is the default option. The following options are available in the drop-down menu:
- terms - refer to Terms aggregation.
- filter - refer to Filter aggregation.
geo hash grid- refer to thegeohash_gridaggregation.- date histogram - for time series queries. Refer to Date histogram aggregation.
- histogram - Depicts frequency distributions. Refer to Histogram aggregation.
- nested (experimental) - Refer to Nested aggregation.
Each group by option has a different subset of options to further narrow your query.
The following options are specific to the date histogram bucket aggregation option.
- Time field - The field used for time-based queries. The default can be set when configuring the data source in the Time field name setting under
Elasticsearch details. The default is
@timestamp. - Interval - The time interval for grouping data. Select from the drop-down menu or enter a custom interval such as
30d(30 days). The default isAuto. - Min doc count - The minimum number of documents required to include a bucket. The default is
0. - Trim edges - Removes partial buckets at the edges of the time range. The default is
0. - Offset - Shifts the start of each bucket by the specified duration. Use positive (
+) or negative (-) values. Examples:1h,5s,1d. - Timezone - The timezone for date calculations. The default is
Coordinated Universal Time.
Configure the following options for the terms bucket aggregation option:
- Order - Sets the order of data. Options are
toporbottom. - Size - Limits the number of documents, or size of the dataset. You can set a custom number or
no limit. - Min doc count - The minimum amount of data to include in your query. The default is
0. - Order by - Order terms by
term value,doc countorcount. - Missing - Defines how documents missing a value should be treated. Missing values are ignored by default, but they can be treated as if they had a value. Refer to Missing value in the Elasticsearch documentation for more information.
Configure the following options for the filters bucket aggregation option:
- Query - Specify the query to create a bucket of documents (data). Examples are
hostname:"hostname1",product:"widget5". Use the * wildcard to match any number of characters. - Label - Add a label or name to the bucket.
Configure the following options for the geo hash grid bucket aggregation option:
- Precision - Specifies the number of characters of the
geo hash.
Configure the following options for the histogram bucket aggregation option:
- Interval - The numeric interval for grouping values into buckets.
- Min doc count - The minimum number of documents required to include a bucket. The default is
0.
The nested group by option is currently experimental, you can select a field and then settings specific to that field.
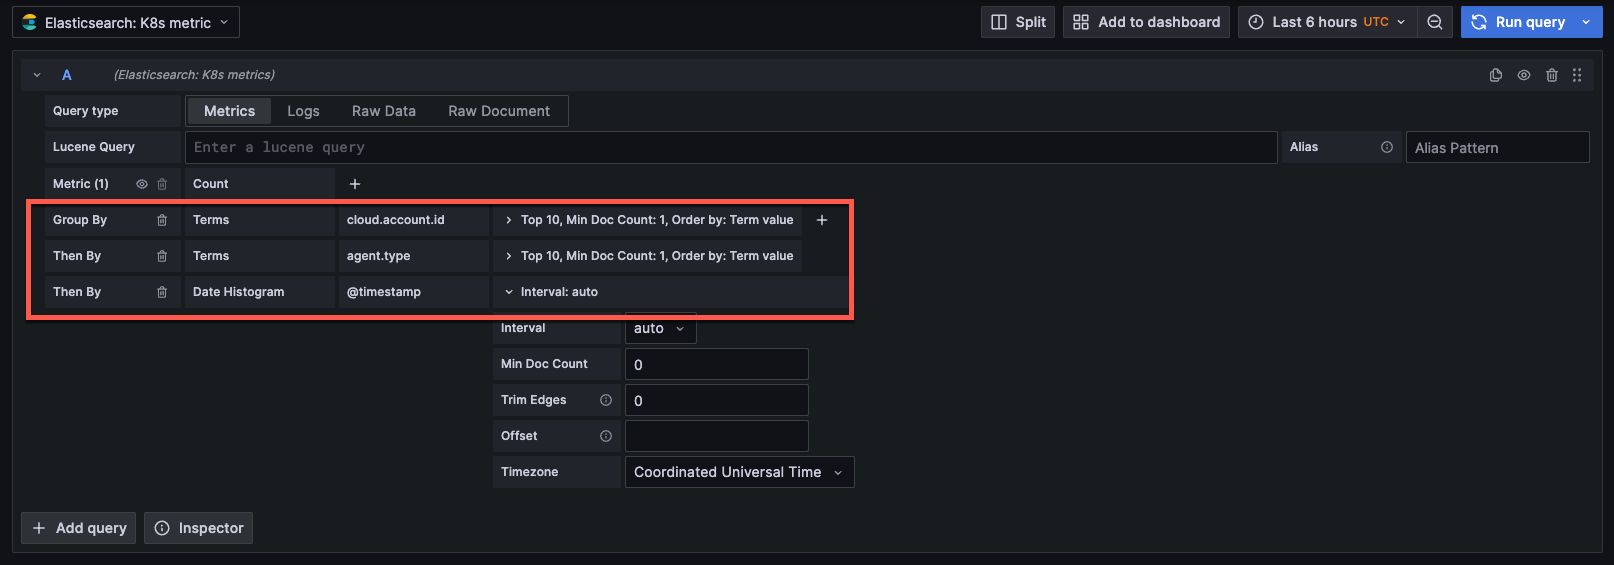
Click the + sign to add multiple group by options. The data is grouped in order (first by, then by).
Logs query type
Logs queries analyze Elasticsearch log data. You can configure the following options:
- Logs Options/Limit - Limits the number of logs to analyze. The default is
500.
Query options
Open the Options section in the query editor to configure query-level settings:
- Limit or Size - For Logs and Raw Data queries, sets the maximum number of documents to return. The default is
500. - Include runtime fields - When enabled, runtime fields defined in the index mapping are included in the response. This option is available in Builder mode.
Raw query editor
The raw query editor lets you write Elasticsearch queries using the native Elasticsearch Query DSL.
Switch between Builder and Code modes
To access the raw query editor, click the Code toggle in the top-right corner of the query editor. You can switch between Builder and Code modes:
- Builder - Visual query builder with dropdown menus and forms
- Code - JSON editor for writing raw Elasticsearch DSL queries
Write raw DSL queries
When in Code mode, you can write complete Elasticsearch query DSL in JSON format. The editor provides:
- Syntax highlighting for JSON
- Auto-formatting - Click the Format button or press
Shift+Alt+Fto format your query - Keyboard shortcuts - Press
Ctrl+Enter(orCmd+Enteron Mac) to run the query - Real-time validation - Invalid JSON is highlighted with error messages
Time range handling
If you want to filter by time range in a dashboard, you need to use the $__from and $__to macros in your raw DSL.
An example query applying dashboard time range using the @timestamp field:
{
  "query": {
    "bool": {
      "must": [
        {
          "range": {
            "@timestamp": {
              "gte": "$__from",
              "lte": "$__to",
              "format": "epoch_millis"
            }
          }
        }
      ]
    }
  }
}
Supported query types
The raw query editor supports all query types:
- Metrics queries are used to query time series data with aggregations. The query parser automatically extracts bucket and metric aggregations from your DSL and uses them for response processing.
- Logs queries are used to query log data.
ES|QL query editor
The ES|QL query editor lets you query Elasticsearch using ES|QL (Elasticsearch Query Language), a pipe-based query language. Unlike Lucene queries that rely on aggregation configuration in the builder UI, ES|QL lets you express filtering, aggregation, and transformation in a single query string.
For an introduction to ES|QL syntax and concepts, refer to Get started with ES|QL queries in the Elasticsearch documentation.
When an ES|QL query does not include a time filter, Grafana automatically adds a time range filter based on the dashboard or Explore time picker.
Index selection
How the editor handles index selection depends on your data source configuration:
- No index name configured: You specify which index to query using the
FROMcommand directly in your ES|QL query. This lets you query any index without creating a separate data source for each one. - Index name configured: The editor automatically inserts
FROM $__indexwhen the ES|QL field receives focus. You can override this and query a different index if needed.
Editor features
The ES|QL code editor provides:
- Code suggestions - Auto-complete for ES|QL commands and functions
- Error highlighting - Syntax errors are highlighted in the editor and error messages from Elasticsearch are displayed directly
- Syntax highlighting - ES|QL keywords, operators, and values are color-coded for readability
Example queries
The following examples show common ES|QL query patterns.
Basic aggregation
Count documents grouped by a field:
FROM logs-*
| STATS count = COUNT(*) BY host.name
| SORT count DESC
| LIMIT 10
Filter and aggregate over time
Filter by a field value and compute an average over time intervals:
FROM metrics-*
| WHERE service.name == "api-gateway"
| STATS avg_duration = AVG(transaction.duration.us) BY @timestamp = BUCKET(@timestamp, 1 minute)
| SORT @timestamp
Search log messages
Search for specific patterns in log data:
FROM logs-*
| WHERE message LIKE "*error*" AND log.level == "ERROR"
| KEEP @timestamp, message, host.name, log.level
| SORT @timestamp DESC
| LIMIT 100
PromQL metrics queries
When you select the Metrics query type, ES|QL also accepts the PROMQL source command. Grafana processes the response as time series frames, the same way it does for ES|QL STATS queries. PROMQL must be the first command in the query (leading comments are allowed):
PROMQL index=metrics-* step=1m avg(metrics.system.cpu.logical.count)Learn more about ES|QL
For more information about ES|QL syntax, commands, and functions, refer to the following Elasticsearch documentation:
- ES|QL reference - Overview of the ES|QL query language
- ES|QL commands - Source and processing commands (
FROM,WHERE,STATS,EVAL,KEEP,SORT,LIMIT, and more) - ES|QL functions and operators - Aggregation, math, string, date, and other functions
- ES|QL syntax - Identifiers, literals, operators, and special characters
Use template variables
You can also augment queries by using template variables.
Queries of terms have a 500-result limit by default.
To set a custom limit, set the size property in your query.



