Welcome to Grafana 12.0! We have a lot to share. This release marks general availability for Grafana Drilldown (previously Explore Metrics, Logs, and Traces), Grafana-managed alerts and recording rules, Cloud migration, and plugin management tooling. You can also try new preview and experimental tools: Sync your dashboards directly to a GitHub repository with Git Sync, and try our new Terraform provider and CLI. Add tabs, new layouts and conditional logic to your dashboards, and load tables and geomaps far faster. Join and transform data limitlessly from multiple sources with SQL Expressions. In Grafana Cloud and Enterprise, sync your users and teams instantly from your SAML identity provider using SCIM (the System for Cross-Domain Identity Management). Lastly, don’t forget to try on one of several new color themes for the user interface.
Read on to learn about these and more improvements to Grafana!
For even more detail about all the changes in this release, refer to the changelog. For the specific steps we recommend when you upgrade to v12.0, check out our
Upgrade Guide.
Breaking changes in Grafana v12.0
For Grafana v12.0, we’ve also provided a list of breaking changes to help you upgrade with greater confidence. For our purposes, a breaking change is any change that requires users or operators to do something. This includes:
Changes in one part of the system that could cause other components to fail
Deprecations or removal of a feature
Changes to an API that could break automation
Changes that affect some plugins or functions of Grafana
Migrations that can’t be rolled back
For each change, the provided information:
Helps you determine if you’re affected
Describes the change or relevant background information
Guides you in how to mitigate for the change or migrate
Grafana CloudExperimentalOpen sourceEnterpriseExperimental
Dashboards and visualizations
Upgrade your Grafana experience with a direct connection with GitHub.
Connect your instance to a GitHub repository, and manage your dashboards as code directly from the Grafana UI. By enabling Git Sync, you will be able to manage dashboards the same way you manage your code. Dashboards will be versioned in Git, and edited through a PR workflow, so that it’s always possible to track changes.
Grafana’s dashboard schema has stayed mostly the same for years, originally built around a single grid layout. Over time, it became more complex and harder to work with, mixing different concerns and adding unnecessary complications. In Grafana v12, we’re introducing a new dashboard schema.
Grafana CloudExperimentalOpen sourceEnterpriseExperimental
Dashboards and visualizations
With this release we’re rethinking our dashboards APIs and introducing a new model that is consistent, versioned, and resource-oriented. We’re releasing them as experimental, with the intent to gather feedback and deliver a stable version to users with one of the next releases.
Grafana CloudGenerally AvailableOpen sourceEnterpriseGenerally Available
At ObsCon last October, we announced the GA of Metrics Drilldown, and we’ve been hard at work expanding its capabilities to help you reduce the number of metrics you need to manage with just a few clicks.
Grafana CloudGenerally AvailableOpen sourceEnterpriseGenerally Available
Last October at ObsCon, we announced the GA of Logs Drilldown, and we’ve been hard at work expanding its capabilities to help you visualize your logs data with more flexibility and options.
Grafana CloudGenerally AvailableOpen sourceEnterpriseGenerally Available
Traces Drilldown
We are excited to announce the General Availability (GA) release of Grafana Traces Drilldown, bringing a simplified, queryless experience to distributed tracing analysis. Building on months of public preview feedback and lessons learned from the Drilldown suite, this GA release delivers a refined, integrated solution for deep-dive trace analysis.
Grafana CloudAvailable in public previewOpen sourceEnterpriseAvailable in public preview
This brand new feature, coming to Public Preview in Grafana v12, is designed to streamline how you approach problem-solving by bringing all your relevant signals together in one unified view.
Logs Drilldown now contains a JSON viewer for structured log lines. With this new feature, users can more easily view, interact, and of course drill down into their JSON data. This table enables users to filter their JSON log lines so that they can view just the data they need in places like the Log Volume visualization.
Grafana CloudGenerally AvailableOpen sourceEnterpriseGenerally Available
We’re excited to announce that the Grafana Cloud Migration Assistant is now generally available to all users! After a successful public preview period, this powerful tool is ready to transform how self-managed Enterprise customers and OSS users transition to Grafana Cloud.
Grafana CloudExperimentalOpen sourceEnterpriseExperimental
Dashboards and visualizations
Last year, we migrated our dashboard architecture to the Scenes library, unlocking a more stable, dynamic, and flexible foundation for the future of Grafana dashboards. Today, we’re excited to showcase what the team has built on top of it, with a strong focus on improving core user workflows: navigating, consuming, and editing dashboards.
Grafana CloudAvailable in public previewOpen sourceEnterpriseAvailable in public preview
Dashboards and visualizations
The table visualization panel just got a major performance boost. Load, sort, and filter large tables many times faster than before, now that the table visualization has been refactored to use the react-data-grid library.
Grafana CloudAvailable in private previewOpen sourceAvailable in private preview
Use the full power of SQL to manipulate and combine results from data sources however you like. You can use it to create new dashboard visualizations and powerful alert and recording rules.
Grafana CloudAvailable in public previewEnterpriseAvailable in public preview
Authentication and authorizationIRM
We are excited to announce SCIM user and group provisioning.
Previously, provisioned users needed to individually sign in to Grafana to exist within the platform, and administrators faced the time-consuming task of creating and managing teams - either manually or via provisioning. This process was complicated and often presented a bottleneck for new team members getting up and running quickly.
Grafana CloudGenerally AvailableOpen sourceEnterpriseGenerally Available
Alerting
We’ve simplified the migration of data source-managed alert rules to Grafana-managed alert rules.
Using these tools and APIs, you can import data source-managed alert rules from Prometheus-compatible systems (Prometheus, Mimir, Loki) into Grafana as Grafana-managed alert rules. This simplifies migrating from data source alerts to Grafana Managed Alerts while preserving behavior of the rules. Alert rules can be imported from an easy-to-use UI tool or through API endpoints compatible with Mimirtool.
Grafana CloudGenerally AvailableOpen sourceEnterpriseGenerally Available
Alerting
Flapping alerts can cause noise and obscure other issues. Now you can set the minimum amount of time that an alert remains firing after the breached threshold expression no longer returns any results. This sets an alert to a “Recovering” state for a duration of time so a re-triggered threshold incurred during this period won’t trigger a new alert.
Grafana CloudGenerally AvailableOpen sourceEnterpriseGenerally Available
Alerting
You can now restore or permanently delete recently deleted Grafana-managed alert rules. Go to Alerts & IRM > Alerting > Recently deleted to see this function in action.
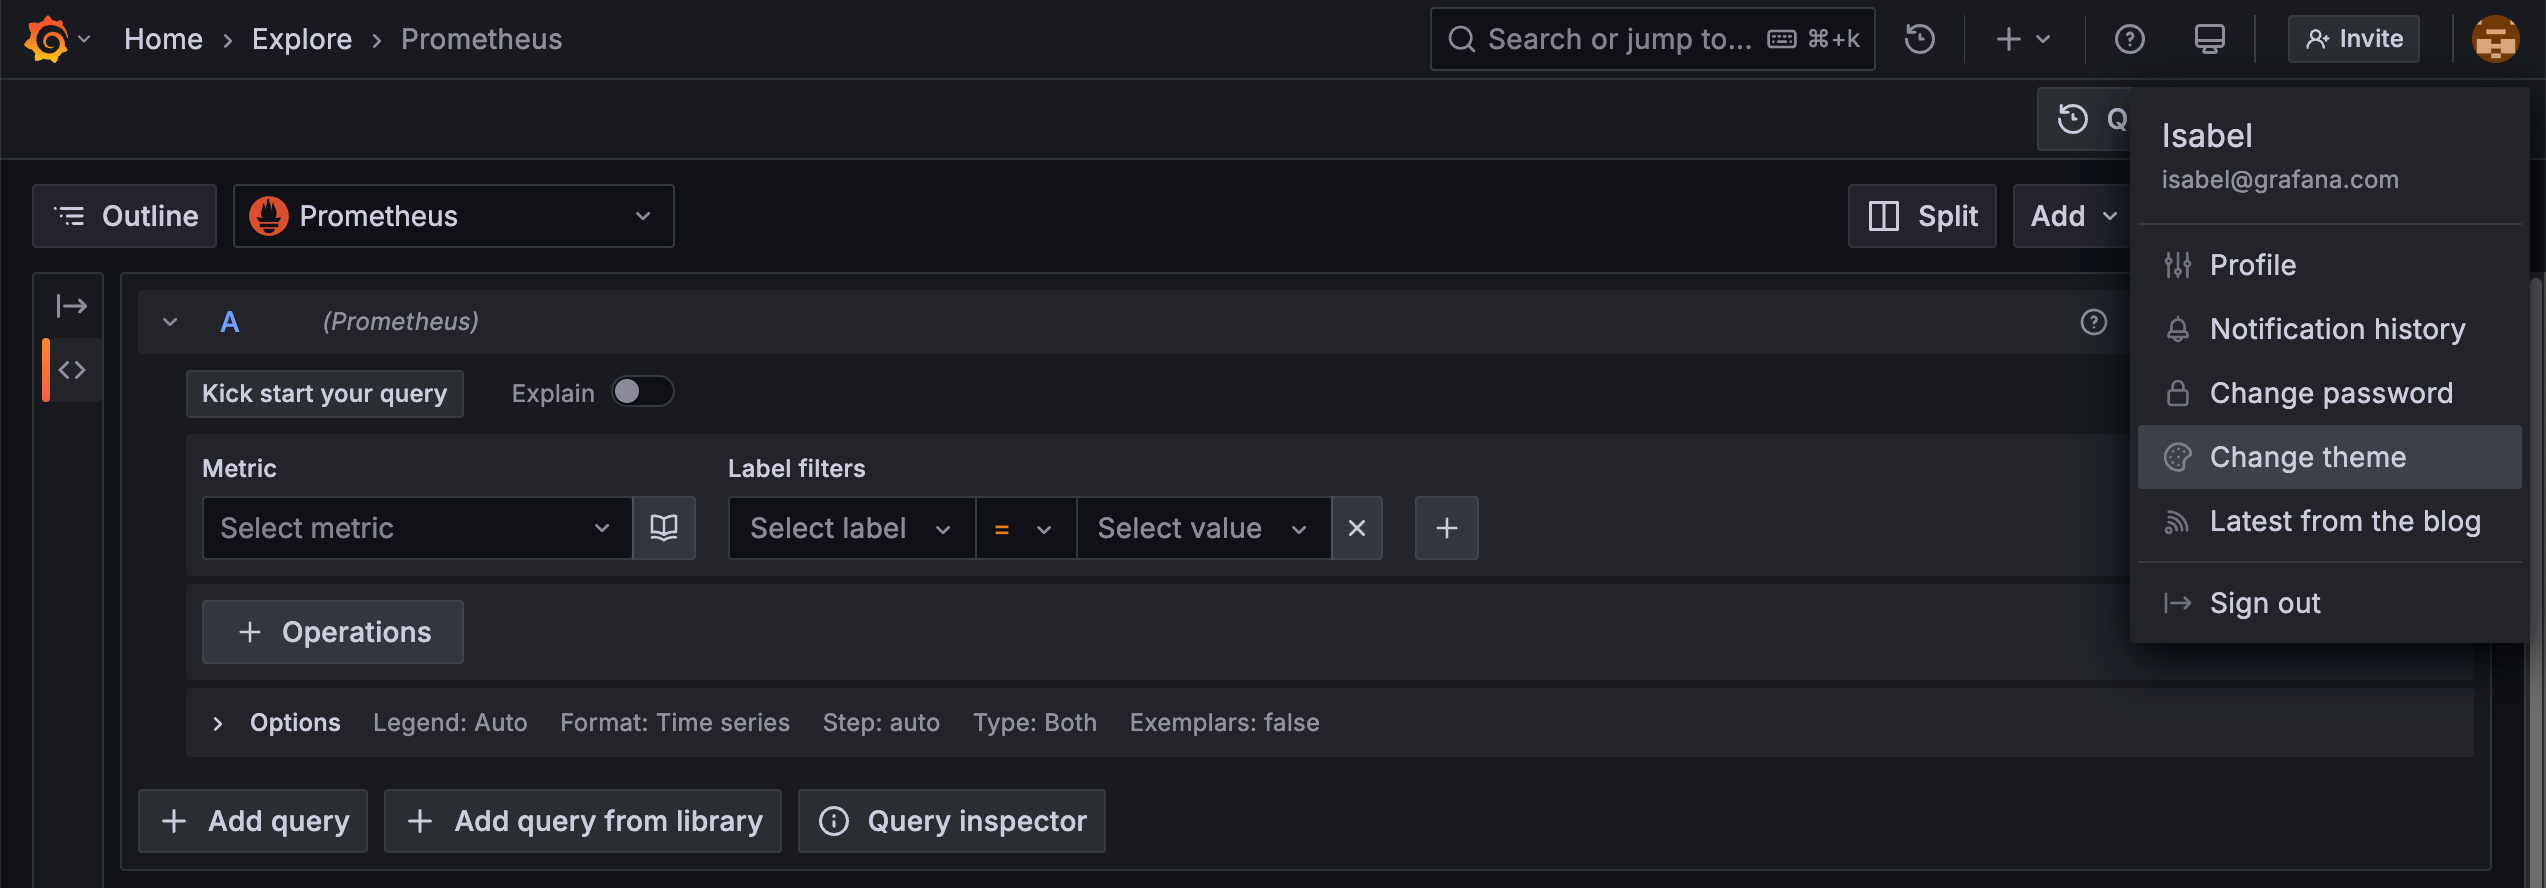
We’re giving the community early access to several new experimental themes to celebrate the release of Grafana 12! You can jazz up your Grafana experience with Sapphire dusk, Tron, Gilded grove, Gloom, or Desert bloom. To see the color scheme of a theme before selecting it, click the user icon in the top-right corner of the page and select Change theme.
Grafana CloudAvailable in public previewOpen sourceEnterpriseAvailable in public preview
ExploreLogs
Introducing new controls for Logs in Explore
We’re excited to introduce a new controls component for Logs in Explore, designed to make better use of the layout around logs, and give users greater flexibility when working with log data.
Grafana CloudGenerally AvailableOpen sourceEnterpriseGenerally Available
TracesExplore
Troubleshooting with traces just got a lot faster in Grafana Cloud. Trace correlations lets you configure custom, context-aware links straight into every span in the trace view. With a single click, you can now jump from a trace to:
Grafana CloudGenerally AvailableOpen sourceEnterpriseGenerally Available
Authentication and authorizationBreaking change
Effective starting in Grafana 12.0, the configuration option editors_can_admin is removed.
The editors_can_admin setting in Grafana allows users with the Editor role to create and manage Grafana Teams. Editors in instances with this configuration setting no longer have these extra privileges, but they are still able to manage teams they already created while the setting was active.
Grafana CloudExperimentalOpen sourceEnterpriseExperimental
Dashboards and visualizationsBreaking change
If the feature flag for dynamic dashboards is enabled, once an existing dashboard is migrated to a dynamic dashboard and using schema v2, it can’t be migrated back. This issue will be solved in future versions of Grafana.
Grafana CloudGenerally AvailableEnterpriseGenerally Available
Breaking change
We were double registering the existing metric cache_size. In Grafana v12 we’re deprecating the metric, with plans to remove it in Grafana v13, and splitting it into 2 different metrics:
Grafana CloudGenerally AvailableOpen sourceEnterpriseGenerally Available
Dashboards and visualizationsBreaking change
Actions were introduced as an optional property for the DataLinksContextMenu in October 2024 to support actions in the context menu for the table visualization. Actions were under a feature flag, so the impact is minimal. There’s no other way to use the property from other places that are using the DataLinksContextMenu component, so we expect the effect to be minimal.
Grafana CloudGenerally AvailableOpen sourceEnterpriseGenerally Available
Data sourcesPluginsBreaking change
We’ve had a standard way to define UIDs for Grafana objects for several years. While all of our internal code complies to this format, we didn’t yet have strict enforcement of this format in REST APIs and provisioning paths that allow the creation and update of data sources.
Grafana CloudGenerally AvailableOpen sourceEnterpriseGenerally Available
PluginsBreaking changeDashboards and visualizations
Angular plugin support was deprecated and turned off by default in Grafana 11 and is now being removed Grafana v12. This means, effective in Grafana v12, there is no possibility anymore to use any Angular plugins in Grafana and the dashboards that were still using “core” Angular panels will be force-migrated to the latest versions that are using React.
Grafana CloudGenerally AvailableOpen sourceEnterpriseGenerally Available
PluginsBreaking change
We’re removing the deprecated version of the UI extension APIs in favor of the new reactive APIs introduced in Grafana v11.4. The new APIs enable Grafana to load plugins with UI extensions lazily when needed instead of needing to load them prior to starting Grafana. They also make the UI reactive, so when the UI extensions registry changes, it will be reflected in the UI.
Open sourceEnterpriseGenerally Available
PluginsBreaking change
Since Grafana v10.2, the endpoint to check compatible versions when installing a plugin using grafana cli plugins install changed, which led to Grafana dependency versions no longer being taken into account. This might have led to the CLI installing plugins that are not fully compatible based on the plugins definition of compatibility via the grafanaDependency property in the plugin.json file.
Grafana CloudGenerally AvailableOpen sourceEnterpriseGenerally Available
Breaking changeTracesTraces Drilldown
Aggregate by was introduced as a way to view RED metrics for your traces in the Tempo data source. This functionality has been deprecated since Grafana v11.3 in favor of using Traces Drilldown and the TraceQL metrics API, which offers much more functionality and complex features. Additionally, TraceQL metrics queries are significantly more powerful than what the metrics summary API provides.
Grafana Cloud has a page in the Admin section that displays feature toggles. A feature toggle is a way to enable or disable certain features before they are generally available. The feature toggle UI shows which toggles are on or off, with options to enable or disable some of those toggles. This UI is experimental.