Trace correlations
You can use Grafana correlations to embed interactive correlation links in your trace view to jump from spans to related logs, metrics, profiles, or external systems. This guide explains how to configure and manage Trace correlations in Grafana.
What are trace correlations?
Trace correlations let you define rules that inject context-sensitive links into your trace spans. When viewing traces in Explore or the Traces panel, users can click these links to navigate directly to relevant queries or URLs. Correlations are similar but more flexible to the trace to logs, metrics, and profiles links you can configure for the Tempo data source.
Before you begin
To use trace correlations, you need:
- Grafana 12 or later
- A Tempo data source configured in Grafana
- Admin access to configuration settings or provisioning files in Grafana
Set up a trace correlation
Log in to Grafana with an administrator account.
Go to Configuration > Plugins & data > Correlations.
Select Add correlation or Add new.
On step 1, provide a label for the correlation, and an optional description.
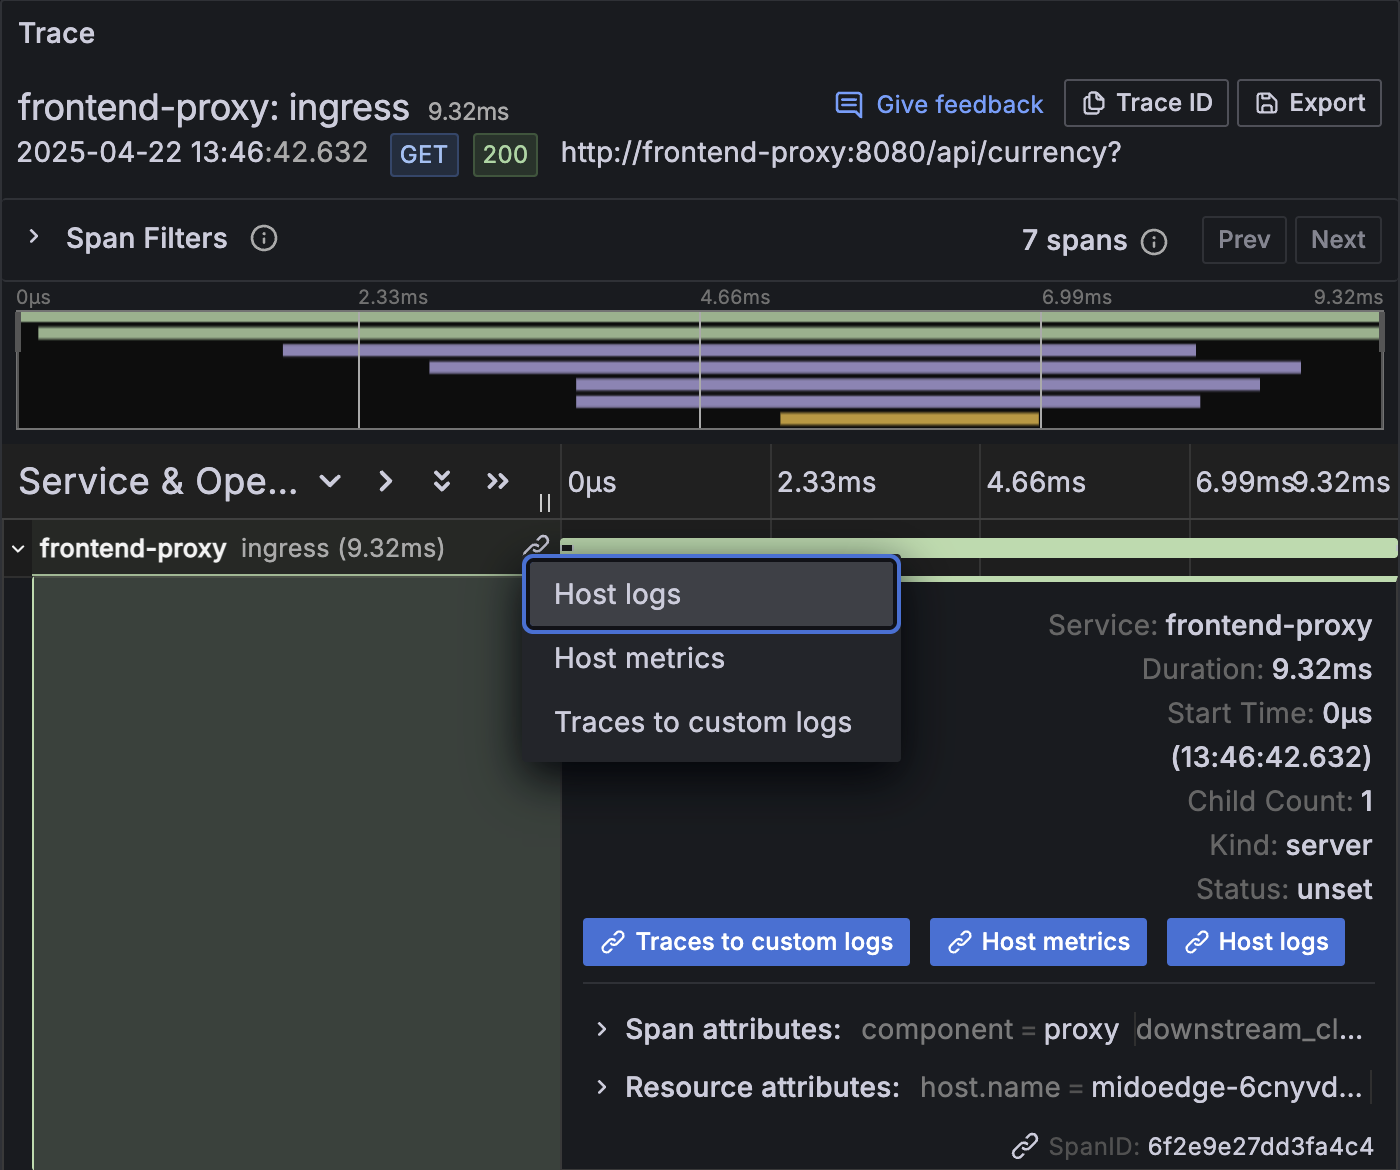
On step 2, configure the correlation target.
Select the Type drop-down list and choose Query to link to another data source or choose External for a custom URL.
For a query Target, select the target drop-down list and select the data source that should be queried when the link is clicked. Define the target query.
For an external Target, enter the External URL.
For both query and external targets, you can use the following variables based on trace data. Object variables must be parsed into a value variable with a regular expression transformation.
![Setting up a correlation for a Loki target using trace variables]()
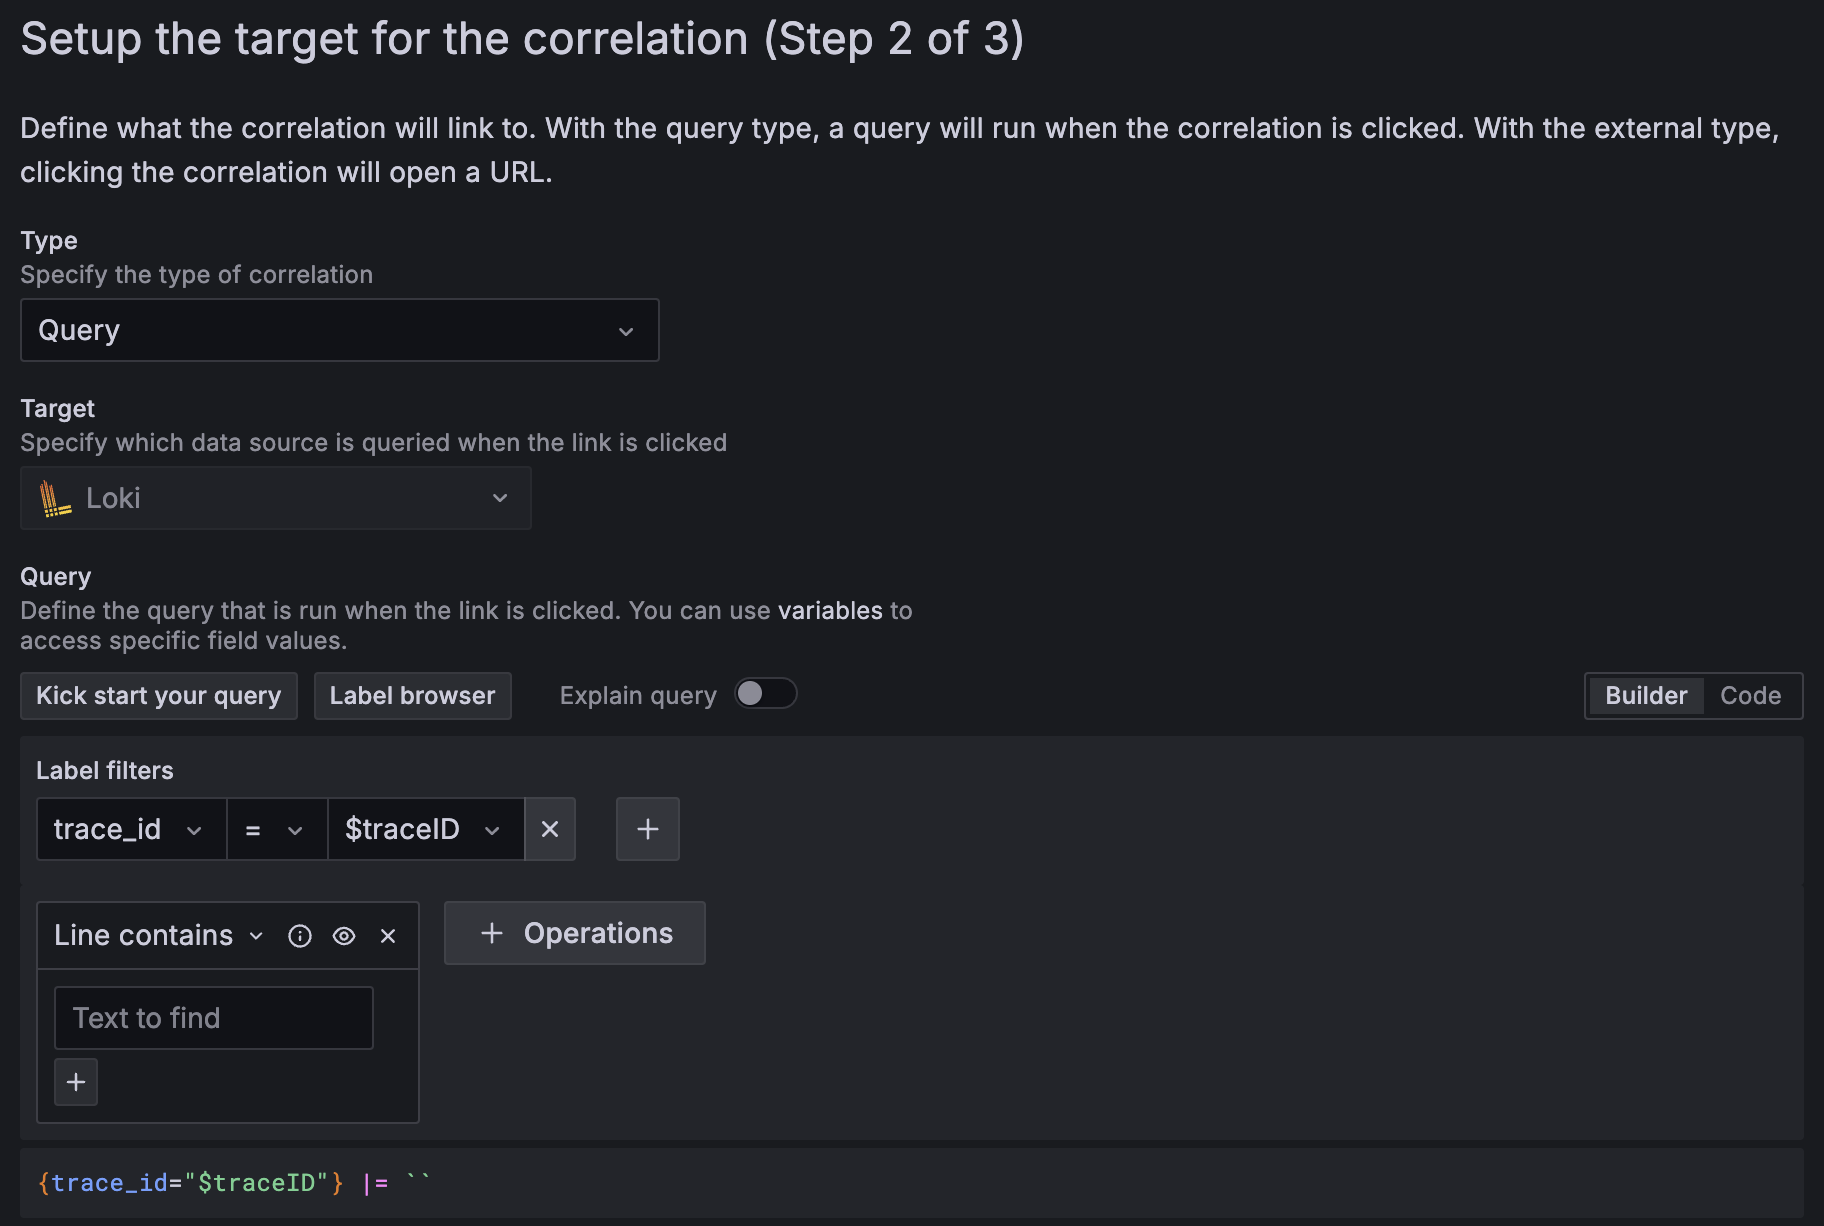
On step 3, configure the correlation data source:
Select your Tempo data source in the Source drop-down list.
Enter the trace data variable you use for the correlation in the Results field.
Optionally, add one or more Transformations to parse the trace data into additional variables. You can use these variables to configure the correlation Target.
![Setting up a correlation for a Loki data source]()
Select Save to save the correlation.
Verifying correlations in Explore
Open Explore and select your Tempo tracing source.
Run a query to load spans.
Hover over the span links menu or open the span details to reveal the correlation link buttons.
![Using correlations for a trace]()
Click a correlation link to open a split view or navigate to your target system or query.

Examples
Below are several practical correlation configurations to get you started.
Example 1: Trace to logs by service name and trace identifier
In this example, you configure trace to logs by service name and a trace identifier.
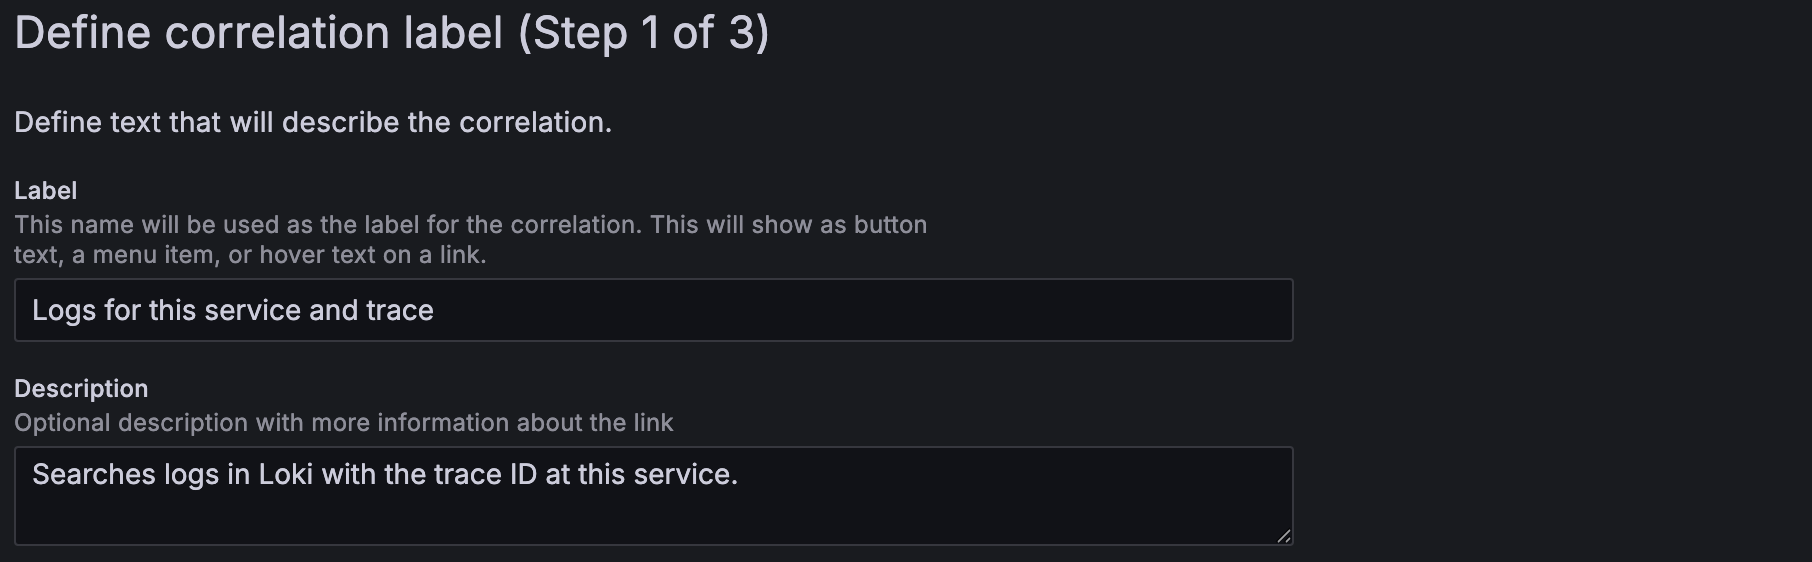
On step 1, add a new correlation with the label Logs for this service and trace and an optional description.
![Using correlations for a trace]()
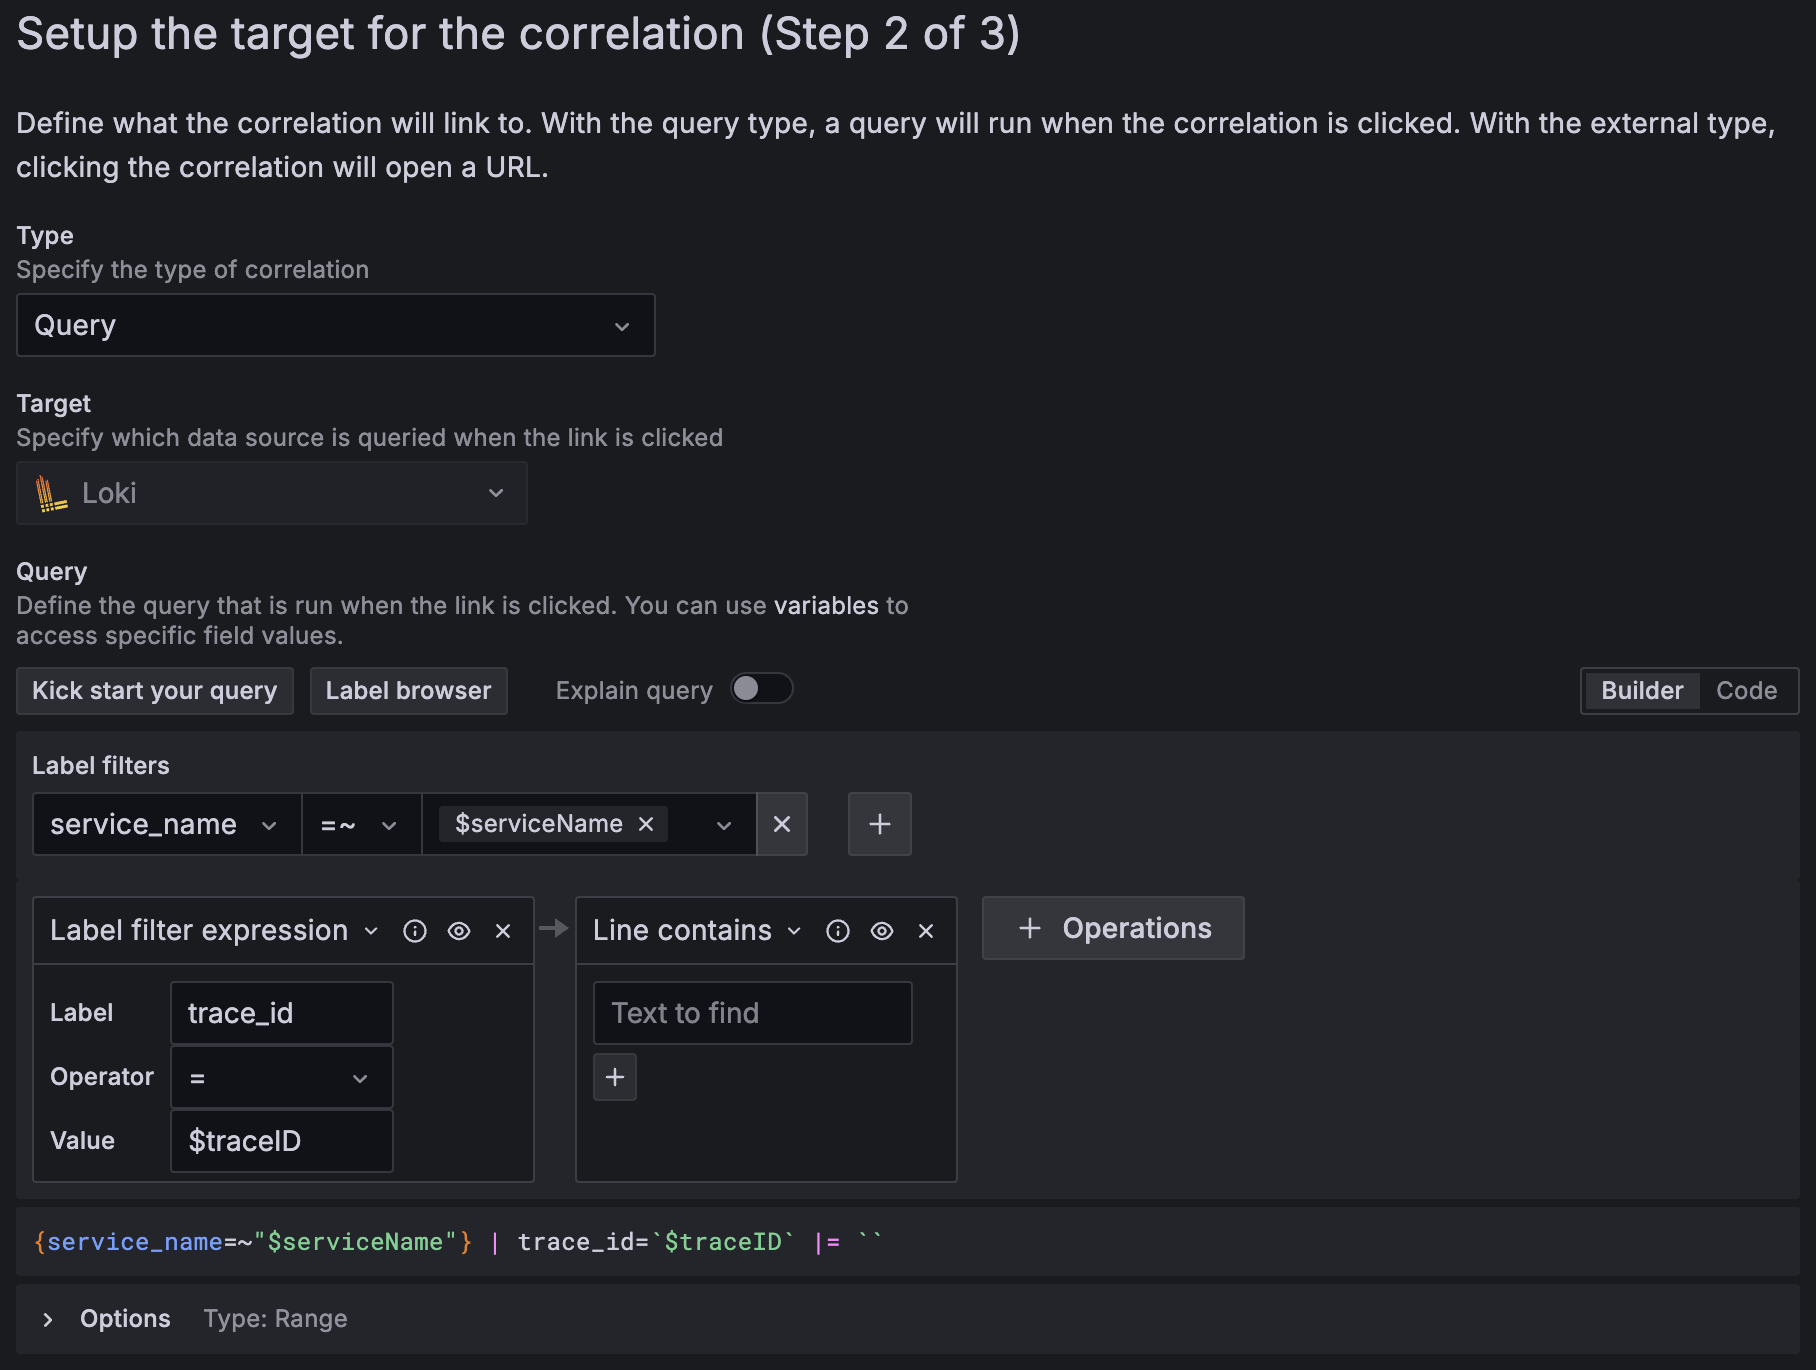
On step 2, configure the correlation target:
Select the target type Query and select your Loki data source as Target.
Define the Loki query, using
serviceNameandtraceIDas variables derived from the span data:{service_name="$serviceName"} | trace_id=`$traceID` |= ``In this query,
service_nameis the only stream label used inside{}. Stream labels should be low-cardinality values that describe the source of your logs. Thetrace_idfield appears after the|pipe as a pipeline filter, which searches log content or structured metadata without creating additional streams. Don’t use trace IDs or other high-cardinality values as stream labels because each unique value creates a separate stream, which degrades Loki performance. For more information, refer to Label best practices and Cardinality.![Using correlations for a trace]()
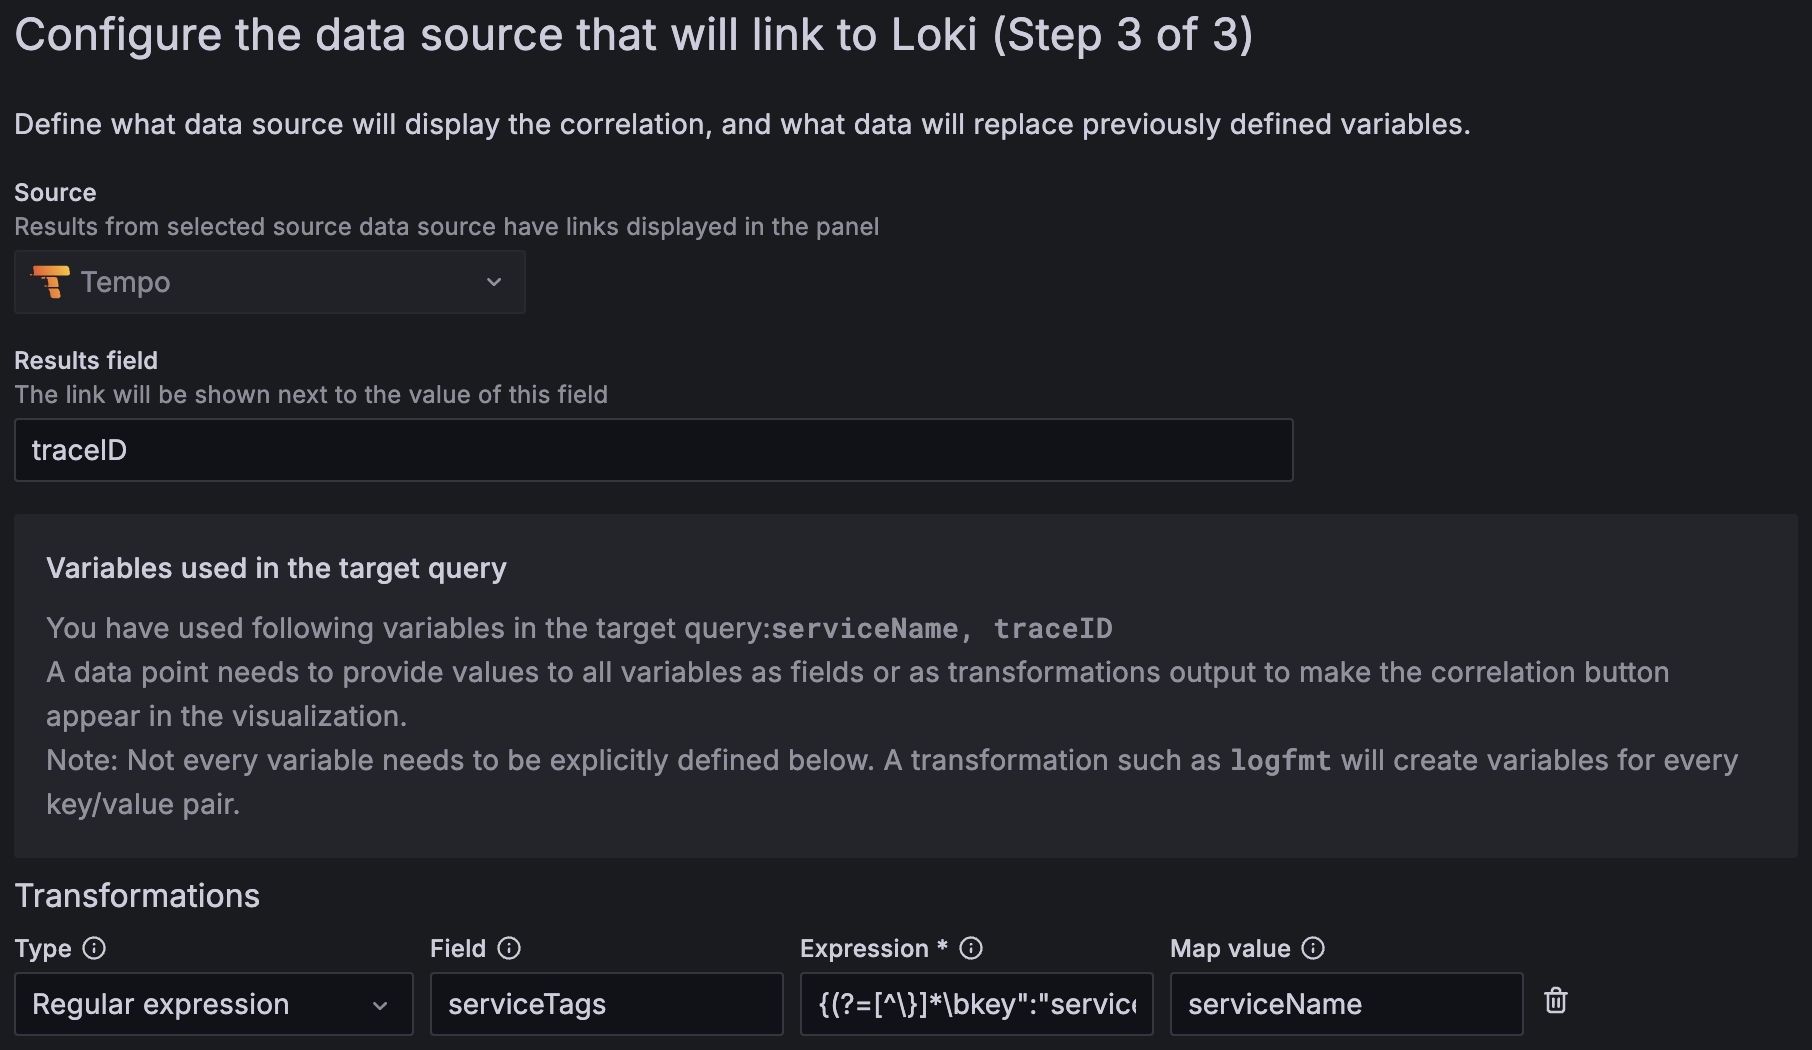
On step 3, configure the correlation source:
Select your Tempo data source as Source.
Use
traceIDas Results field.Add a new transformation to extract the
serviceNamefrom the spanserviceTagsusing the regular expression:{(?=[^\}]*\bkey":"service.name")[^\}]*\bvalue":"(.*?)".*}
![Using correlations for a trace]()
Save the correlation.
Example 2: Trace to custom URL
In this example, you configure trace correlations with a custom URL.
On step 1, add a new correlation with the label Open custom URL and an optional description.
On step 2, configure the correlation target:
Select the target type External.
Define your target URL, using variables derived from the span data. In this example, we are using
serviceNameandtraceID.https://my-server.example.com/service=$serviceName&trace=$traceID
On step 3, configure the correlation source:
Select your Tempo data source as Source.
Use
traceIDas Results field.Add a new transformation to extract the
serviceNamefrom the spanserviceTagsusing the regular expression:{(?=[^\}]*\bkey":"service.name")[^\}]*\bvalue":"(.*?)".*}
Save the correlation.
Best practices
Name clearly: Use descriptive names indicating source and target. For example: Trace to errors in logs.
Use low-cardinality stream labels: When targeting Loki, use only low-cardinality values like
service_name,namespace, orclusterinside the stream selector{}. Place high-cardinality values like trace IDs in pipeline filters (after|) or store them as structured metadata. Using trace IDs as stream labels creates excessive streams and degrades Loki performance. For more information, refer to Cardinality and Label best practices. For detailed guidance on mapping span attributes to Loki labels, refer to Configure trace to logs correlation.Template wisely: Use multiple
$variabletokens if you need to inject more than one field.
Next steps
- Configure trace to logs correlation: Link spans to log queries in Loki with tag mapping and cardinality guidance.
- Configure trace to metrics correlation: Link spans to metrics queries in Prometheus.
- Configure trace to profiles correlation: Link spans to profiling data in Grafana Pyroscope.
- Configure the Tempo data source: Return to connection, authentication, and streaming settings.


