
This is documentation for the next version of Grafana. For the latest stable release, go to the latest version.
Get started with Grafana and Prometheus
Prometheus is an open source monitoring system for which Grafana provides out-of-the-box support. This topic walks you through the steps to create a series of dashboards in Grafana to display system metrics for a server monitored by Prometheus.
Tip
Check out our Prometheus Learning Journeys.
- Connect to a Prometheus data source in Grafana Cloud to visualize your metrics directly from where they are stored.
- Send metrics to Grafana Cloud using Prometheus remote write to explore Grafana Cloud without making significant changes to your existing configuration.
Grafana and Prometheus:
- Download Prometheus and Node exporter
- Install Prometheus Node exporter
- Install and configure Prometheus
- Configure Prometheus for Grafana
- Check Prometheus metrics in Grafana Explore view
- Start building dashboards
Download Prometheus and Node exporter
Download the following components:
Like Grafana, you can install Prometheus on many different operating systems. Refer to the Prometheus download page to see a list of stable versions of Prometheus components.
Install Prometheus Node exporter
Install Node exporter on all hosts you want to monitor. This guide shows you how to install it locally.
Prometheus Node exporter is a widely used tool that exposes system metrics. For instructions on installing Node exporter, refer to the Installing and running the Node exporter section in the Prometheus documentation.
When you run Node exporter locally, navigate to http://localhost:9100/metrics to check that it is exporting metrics.
Note
The instructions in the referenced topic are intended for Linux users. You may have to alter the instructions slightly depending on your operating system. For example, if you are on Windows, use the windows_exporter instead.
Install and configure Prometheus
After downloading Prometheus, extract it and navigate to the directory.
tar xvfz prometheus-*.tar.gz
cd prometheus-*
Locate the
prometheus.ymlfile in the directory.Modify the Prometheus configuration file to monitor the hosts where you installed Node exporter.
By default, Prometheus looks for the file prometheus.yml in the current working directory. This behavior can be changed via the --config.file command line flag. For example, some Prometheus installers use it to set the configuration file to /etc/prometheus/prometheus.yml.
The following example shows you the code you should add. Notice that static configs targets are set to ['localhost:9100'] to target node-explorer when running it locally.
 # A scrape configuration containing exactly one endpoint to scrape from Node exporter running on a host:
 scrape_configs:
     # The job name is added as a label `job=<job_name>` to any timeseries scraped from this config.
     - job_name: 'node'

     # metrics_path defaults to '/metrics'
     # scheme defaults to 'http'.

       static_configs:
       - targets: ['localhost:9100']
Start the Prometheus service:
./prometheus --config.file=./prometheus.ymlConfirm that Prometheus is running by navigating to
http://localhost:9090.
You can see that the Node exporter metrics have been delivered to Prometheus. Next, the metrics will be sent to Grafana.
Configure Prometheus for Grafana
When running Prometheus locally, there are two ways to configure Prometheus for Grafana. You can use a hosted Grafana instance at Grafana Cloud or run Grafana locally.
This guide describes configuring Prometheus in a hosted Grafana instance on Grafana Cloud.
- Sign up for https://grafana.com/. Grafana gives you a Prometheus instance out of the box.
- Because you are running your own Prometheus instance locally, you must
remote_writeyour metrics to the Grafana.com Prometheus instance. Grafana provides code to add to yourprometheus.ymlconfig file. This includes a remote write endpoint, your user name and password.
Add the following code to your prometheus.yml file to begin sending metrics to your hosted Grafana instance.
remote_write:
- url: <https://your-remote-write-endpoint>
  basic_auth:
    username: <your user name>
    password: <Your Grafana.com API Key>
Note
To configure your Prometheus instance to work with Grafana locally instead of Grafana Cloud, install Grafana here and follow the configuration steps listed here.
Troubleshooting
These are some of the troubleshooting steps you can try if Prometheus isn’t running or functioning as expected. The steps provided have been selected based on the Learning Journeys we offer for Prometheus. If you’d like to explore further, check out the Prometheus Learning Journey if you want to visualize data in Grafana Cloud without sending or storing data in Grafana Cloud, such as for local retention needs. Alternatively, if you already have a Prometheus setup and want to explore Grafana Cloud without making significant changes, visit the Prometheus remote write learning journey.
1. Checking if Prometheus is running
If the Prometheus web UI is inaccessible (e.g., “Connection refused” error in the browser) or Prometheus queries fail (e.g., errors in Grafana like “Data source unavailable” or “No data points”), a good place to start is confirming that the Prometheus process and service are running.
You can do this by checking the system process or verifying the service status:
Linux
sudo systemctl status prometheus- Shows whether the process is running and if the service is active.
MacOS
pgrep prometheus- Returns the process ID (PID) if Prometheus is running.
Windows (PowerShell)
Get-Process -Name prometheus -ErrorAction SilentlyContinue- Checks if the Prometheus process is running by name.
2. If Prometheus is not running
Start by checking for common causes:
Check for port conflicts.
Prometheus runs on port 9090 by default. If another process is using this port, Prometheus may fail to start. You can check for port conflicts with:
Linux & MacOS
lsof -i :9090Windows (PowerShell)
netstat -ano | findstr :9090- Shows if another process is using port 9090.
Verify the Prometheus binary placement: ensure Prometheus binaries (prometheus and promtool) are correctly installed.
Linux & MacOS
ls /usr/local/bin/prometheus /usr/local/bin/promtool- If missing, move them to
/usr/local/binor a directory in your system’s PATH.
Check if Prometheus is in the path.
which prometheus
which promtool- If there’s no output, the binaries are not in the system PATH.
Ensure configuration & data files are in place.
Linux & MacOs
ls /etc/prometheus /var/lib/prometheus
ls /etc/prometheus/prometheus.yml- Makes sure that Prometheus has its necessary configuration and data storage directories.
Check permissions: If Prometheus is running as a dedicated user, ensure the correct ownership:
sudo chown -R prometheus:prometheus /etc/prometheus /var/lib/prometheus(Optional) Secure Prometheus by creating a dedicated user
sudo useradd --no-create-home --shell /bin/false prometheus- Recommended for security: runs Prometheus as a non-login user.
3. Checking if Prometheus is running as a service
If Prometheus is running as a process, check whether it is properly set up and managed as a service to ensure it restarts automatically after reboots or failures.
Check Prometheus service status
Linux
systemctl status prometheus.serviceWindows
sc query prometheusMacOs
pgrep prometheus- If the service is inactive (dead) or stopped, proceed to the next steps.
4. If Prometheus is not running as a service
If Prometheus is not running as a managed service, ensure it is correctly configured and can restart automatically.
Verify service configuration (Linux & MacOs)
Check the service unit file to ensure correct paths:
sudo nano /etc/systemd/system/prometheus.service- Look for the
ExecStartline:
ExecStart=/usr/local/bin/prometheus --config.file=/etc/prometheus/prometheus.yml --storage.tsdb.path=/var/lib/prometheus/- Ensure:
- The binary path (
/usr/local/bin/prometheus) is correct. - The configuration file (
/etc/prometheus/prometheus.yml) is in place. - The storage path (
/var/lib/prometheus/) exists.
- The binary path (
Restart and enable Prometheus service (Linux & MacOs)
sudo systemctl daemon-reload
sudo systemctl enable prometheus
sudo systemctl start prometheus
sudo systemctl status prometheus
Check Prometheus health status
After restarting, verify if Prometheus is responsive:
curl -s http://localhost:9090/-/ready- If successful, this confirms Prometheus is ready to serve requests.
Restart Prometheus service (Windows)
If running as a Windows service, restart it:
net stop prometheus
net start prometheus
5. Checking if Prometheus is capturing metrics
If you installed Node exporter to expose your system metrics, you can check if Prometheus is capturing metrics by sending a request to the /metrics endpoint.
curl http://localhost:9090/metrics- It should return a number of metrics and metadata about the metrics being exposed.
Check Prometheus metrics in Grafana Metics Drilldown
In your Grafana instance, go to the Drilldown view and experience query-less browsing of Prometheus-compatible metrics.
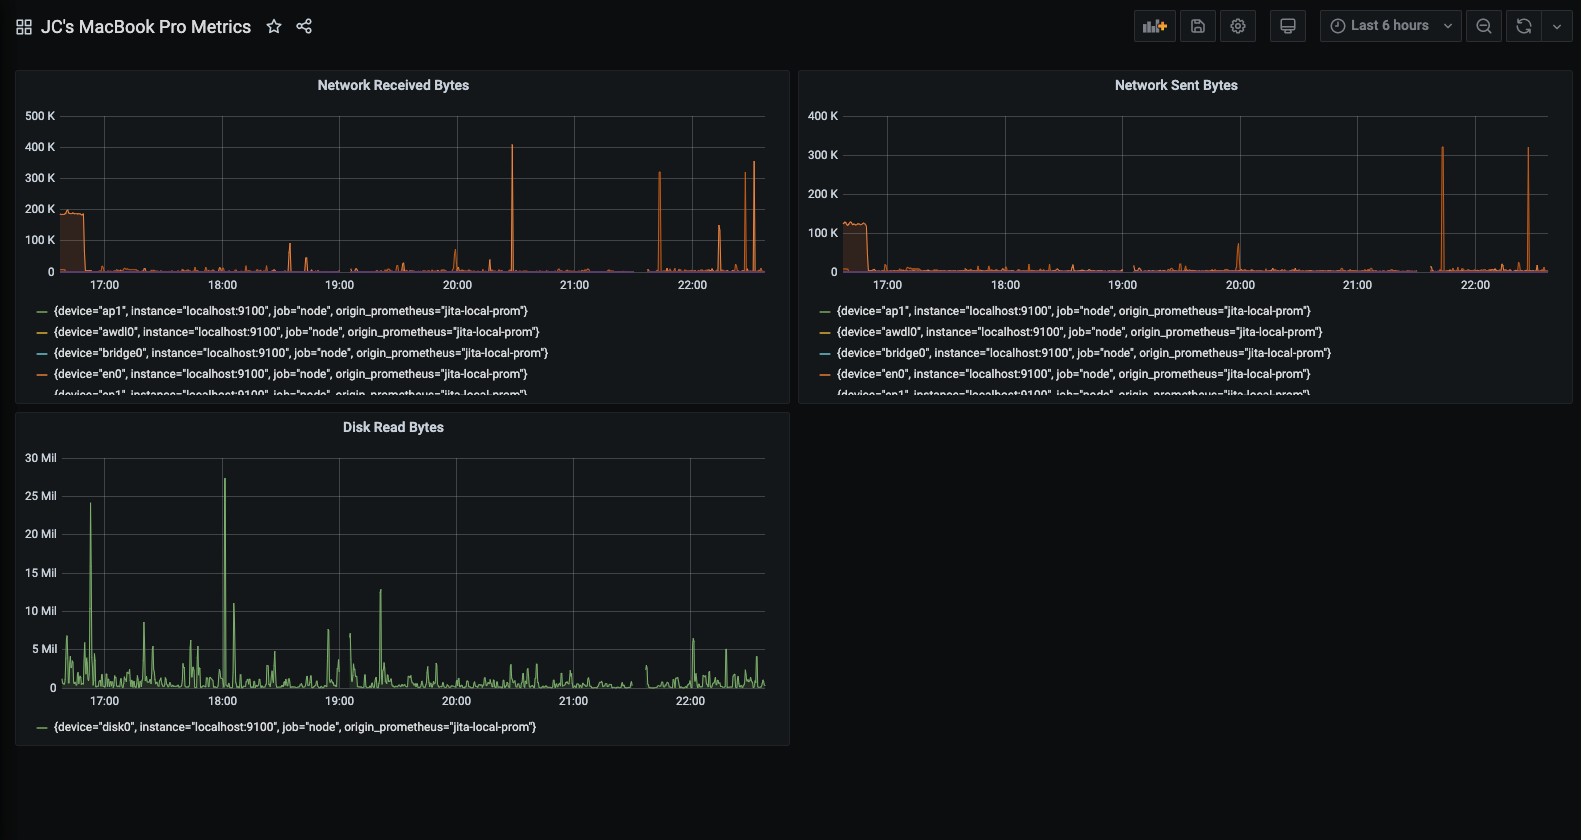
Start building dashboards
Now that you have a curated list of queries, create dashboards to render system metrics monitored by Prometheus. When you install Prometheus and Node exporter or windows_exporter, you will find recommended dashboards for use.
The following image shows a dashboard with three panels showing some system metrics.
To learn more:
- Grafana documentation: Prometheus data source
- Prometheus documentation: What is Prometheus?
Was this page helpful?
Related resources from Grafana Labs


