Set up Grafana for high availability
Note
To prevent duplicate alerts in Grafana high availability, additional steps are required.
Please refer to Alerting high availability for more information.
Grafana uses an embedded sqlite3 database to store users, dashboards, and other persistent data by default. For high availability, you must use a shared database to store this data. This shared database can be either MySQL or Postgres.
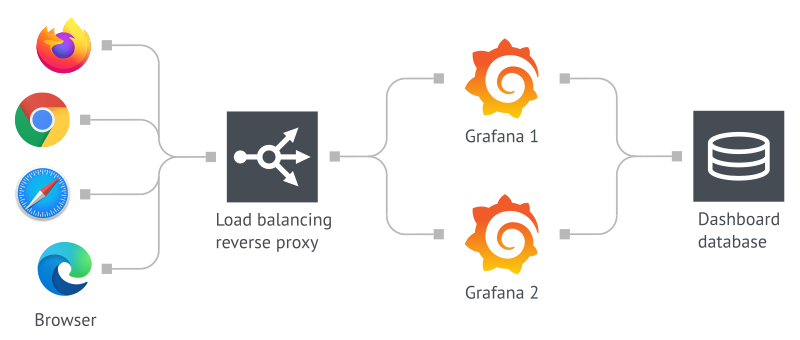
Architecture
Your Grafana high availability environment will consist of two or more Grafana servers (cluster nodes) served by a load balancing reverse proxy. The cluster uses an active-active architecture with the load balancer allocating traffic between nodes and re-allocating traffic to surviving nodes should there be failures. You need to configure your load balancer with a listener that responds to a shared cluster hostname. The shared name is the hostname your users use to access Grafana.
For ease of use, we recommend you configure your load balancer to provide SSL termination. The shared Grafana database tracks session information, so your load balancer won’t need to provide session affinity services. See your load balancer’s documentation for details on its configuration and operations.
Before you begin
Before you complete the following tasks, configure a MySQL or Postgres database to be highly available. Configuring the MySQL or Postgres database for high availability is out of the scope of this guide, but you can find instructions online for each database.
Configure multiple Grafana servers to use the same database
Once you have a Postgres or MySQL database available, you can configure your multiple Grafana instances to use a shared backend database. Grafana has default and custom configuration files, and you can update the database settings by updating your custom configuration file as described in the [database]. Once configured to use a shared database, your multiple Grafana instances will persist all long-term data in that database.
Grafana Enterprise only: License your Grafana servers
If you’re using Grafana Enterprise:
- Get a license token in the name of your cluster’s shared hostname.
- Edit the
root_urlsetting in each node’sgrafana.iniconfiguration file to reflect the cluster’s shared hostname. - Install the license key as normal. For more information on installing your license key, refer to Add your license to a Grafana instance.
Alerting high availability
Grafana Alerting provides a high availability mode. It preserves the semantics of legacy dashboard alerting by executing all alerts on every server and by sending notifications only once per alert. Load distribution between servers is not supported at this time.
For further information and instructions on setting up alerting high availability, refer to Enable alerting high availability.
Legacy dashboard alerts
Legacy Grafana Alerting supports a limited form of high availability. In this model, alert notifications are deduplicated when running multiple servers. This means all alerts are executed on every server, but alert notifications are only sent once per alert. Grafana does not support load distribution between servers.
Grafana Live
Grafana Live works with limitations in highly available setup. For details, refer to the Configure Grafana Live HA setup.
User sessions
Grafana uses auth token strategy with database by default. This means that a load balancer can send a user to any Grafana server without having to log in on each server.


