

News
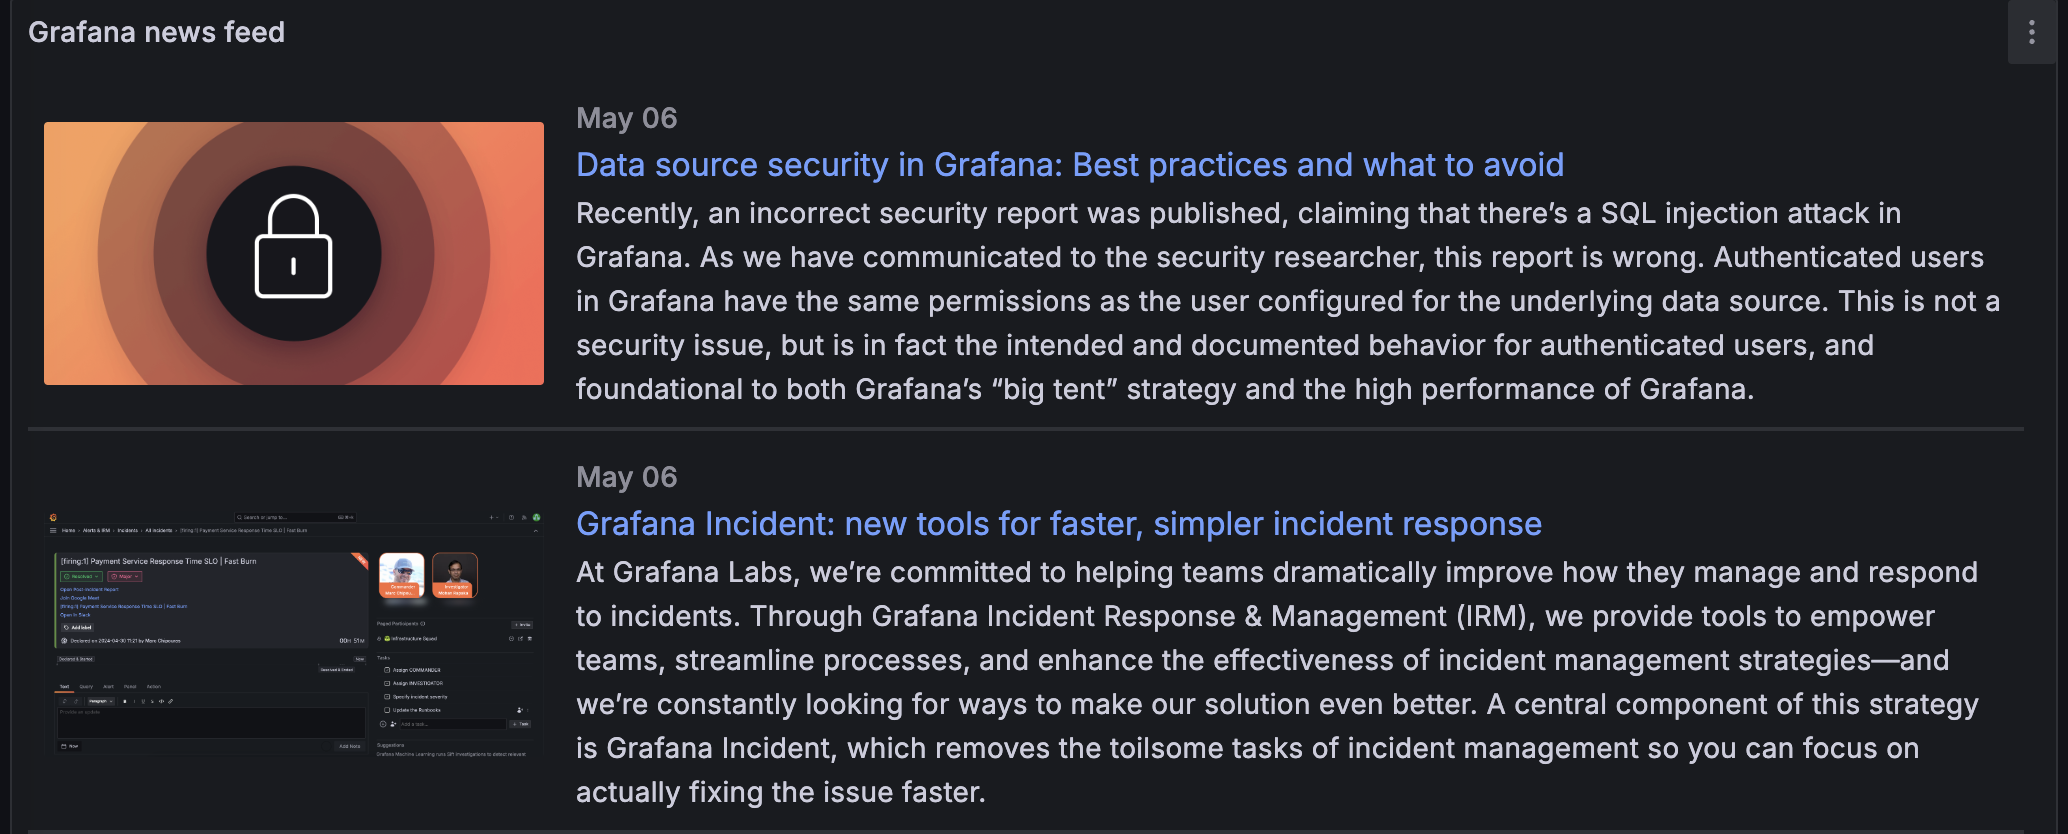
The news visualization displays an RSS feed. By default, it displays articles from the Grafana Labs blog, but you can change this by entering a different RSS feed URL.
Note
In version 8.5, we discontinued the “Use Proxy” option for Grafana news visualizations. As a result, RSS feeds that are not configured for request by Grafana’s frontend (with the appropriate CORS headers) may not load.
You can use the news visualization to provide regular news and updates to your users.

With Grafana Play, you can explore and see how it works, learning from practical examples to accelerate your development. This feature can be seen on News Panel.
Refresh the news feed
The news visualization doesn’t have its own refresh interval. It requests the feed when the dashboard first loads and each time the dashboard refreshes.
To update the articles, do one of the following:
- Refresh the dashboard manually: Click the Refresh dashboard icon.
- Set an auto-refresh interval: Click the drop-down next to the Refresh dashboard icon and select an interval. For more information on setting these intervals, refer to Refresh dashboard.
The refresh interval applies to the whole dashboard, so pick one that suits your other visualizations as well as your feed.
Configure a news visualization
After you’ve created a dashboard, enter the URL of an RSS in the URL field in the News section. This visualization type doesn’t accept any other queries, and you shouldn’t expect to be able to filter or query the RSS feed data in any way using this visualization.
If you’re having trouble loading an RSS feed, you can try re-hosting the feed on a different server or using a CORS proxy. A CORS proxy is a tool that allows you to bypass CORS restrictions by making requests to the RSS feed on your behalf. You can find more information about using CORS proxies online.
If you’re unable to display an RSS feed using the news visualization, you can try using the community RSS/Atom data source plugin RSS/Atom data source in combination with the Dynamic text community panel Dynamic text. This allows you to display the RSS feed in a different way.
Supported data formats
The news visualization supports RSS and Atom feeds.
Configuration options
The following section describes the configuration options available in the panel editor pane for this visualization. These options are, as much as possible, ordered as they appear in Grafana.
Panel options
In the Panel options section of the panel editor pane, set options like the panel title, description, and show/hide rules. To learn more, refer to Configure panel options.
News options
Use the following options to refine your news visualization:
- URL - The URL of the RSS or Atom feed. If you leave the field empty, the Grafana Labs blog is used.
- Show image - Controls if the news social image displays beside the text content.
Was this page helpful?
Related resources from Grafana Labs



