

Graphite query editor
Grafana includes a Graphite-specific query editor to help you build queries. The query editor helps you quickly navigate the metric space, add functions, and change function parameters. It supports a variety of Graphite queries, including complex nested queries, through the use of query references.
For general documentation on querying data sources in Grafana, refer to Query and transform data.
Query editor elements
The query editor consists of the following elements:
Series: A series in Graphite is a unique time-series dataset, represented by a specific metric name and timestamped values. Click select metric to choose a metric from the drop-down.
Functions: Graphite uses functions to manipulate data. Click the + sign to view a list of functions in the drop-down. You can add multiple functions to a query.
To view the raw query, click the Pencil icon in the upper right. Click the Pencil icon again to continue adding series and functions.
Choose metrics to query
Click select metric to browse the available metrics. You can navigate using your mouse or arrow keys. You can also select a wildcard.
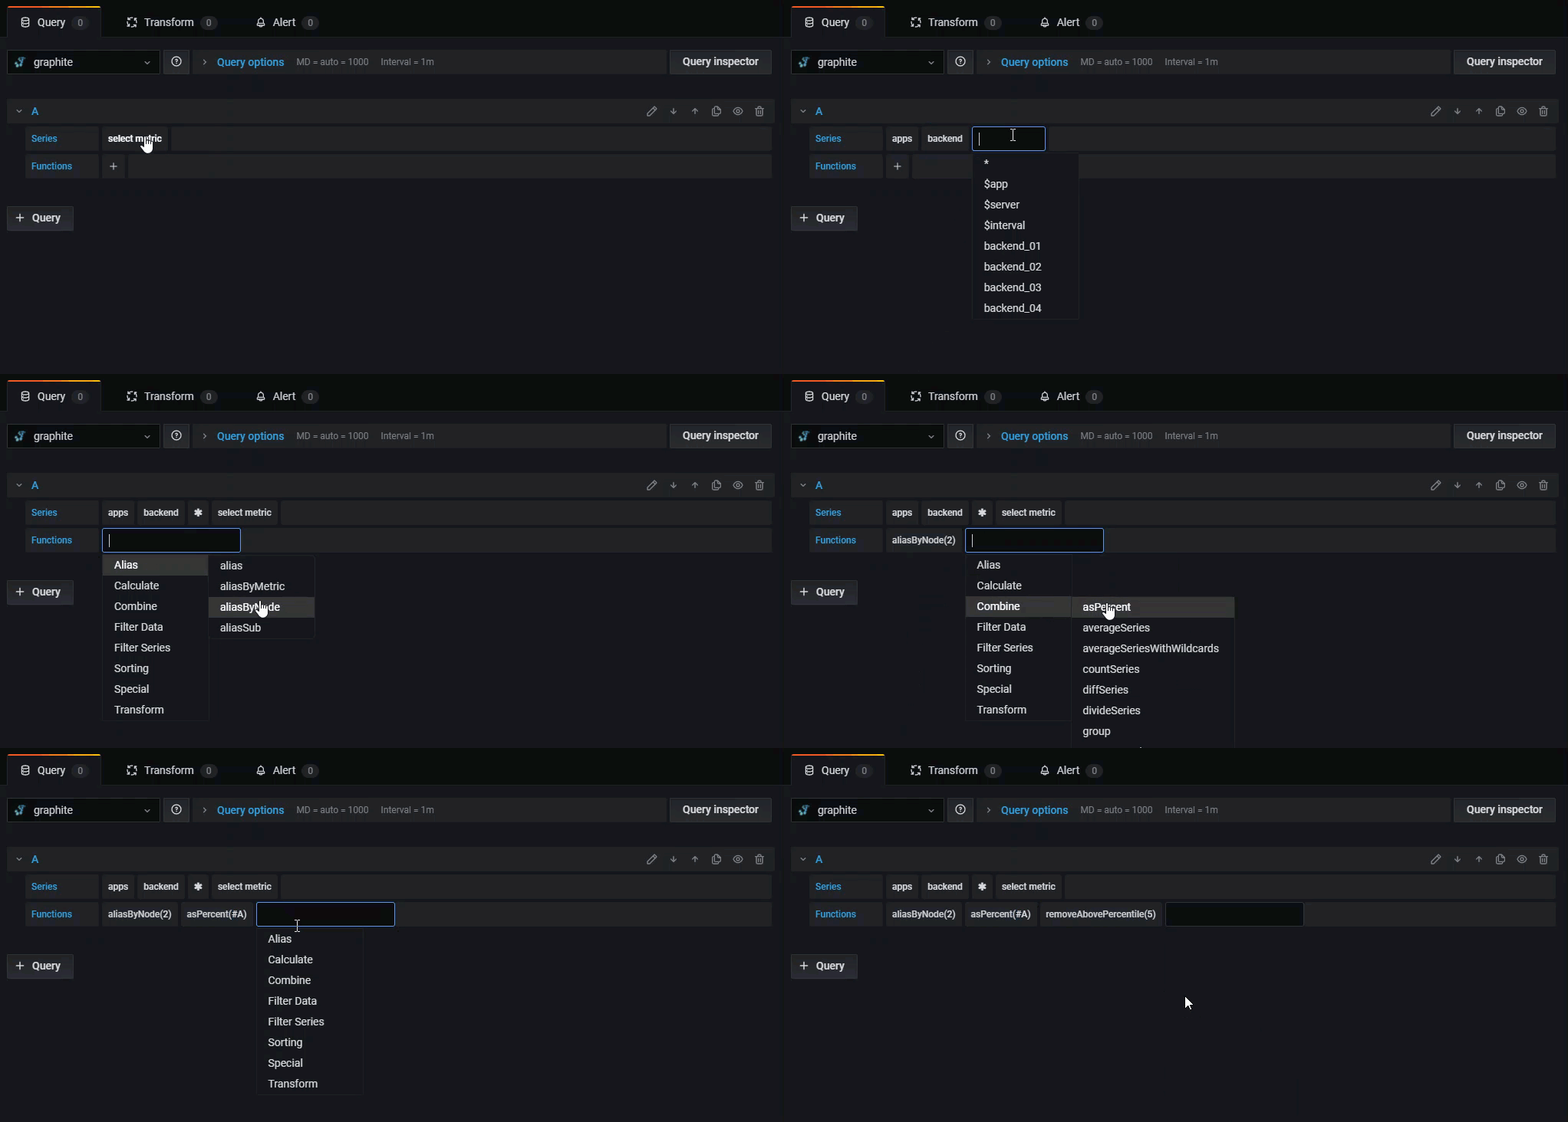
Functions
Click the + sign next to Function to add a function from the drop-down. You can also search by typing the first few letters of the function name.
After selecting a function, Grafana adds it to your query and automatically places your cursor in the first parameter field.
To edit a parameter, click it to open an editable text box.
To remove a function, click it, then click the X icon that appears above it.
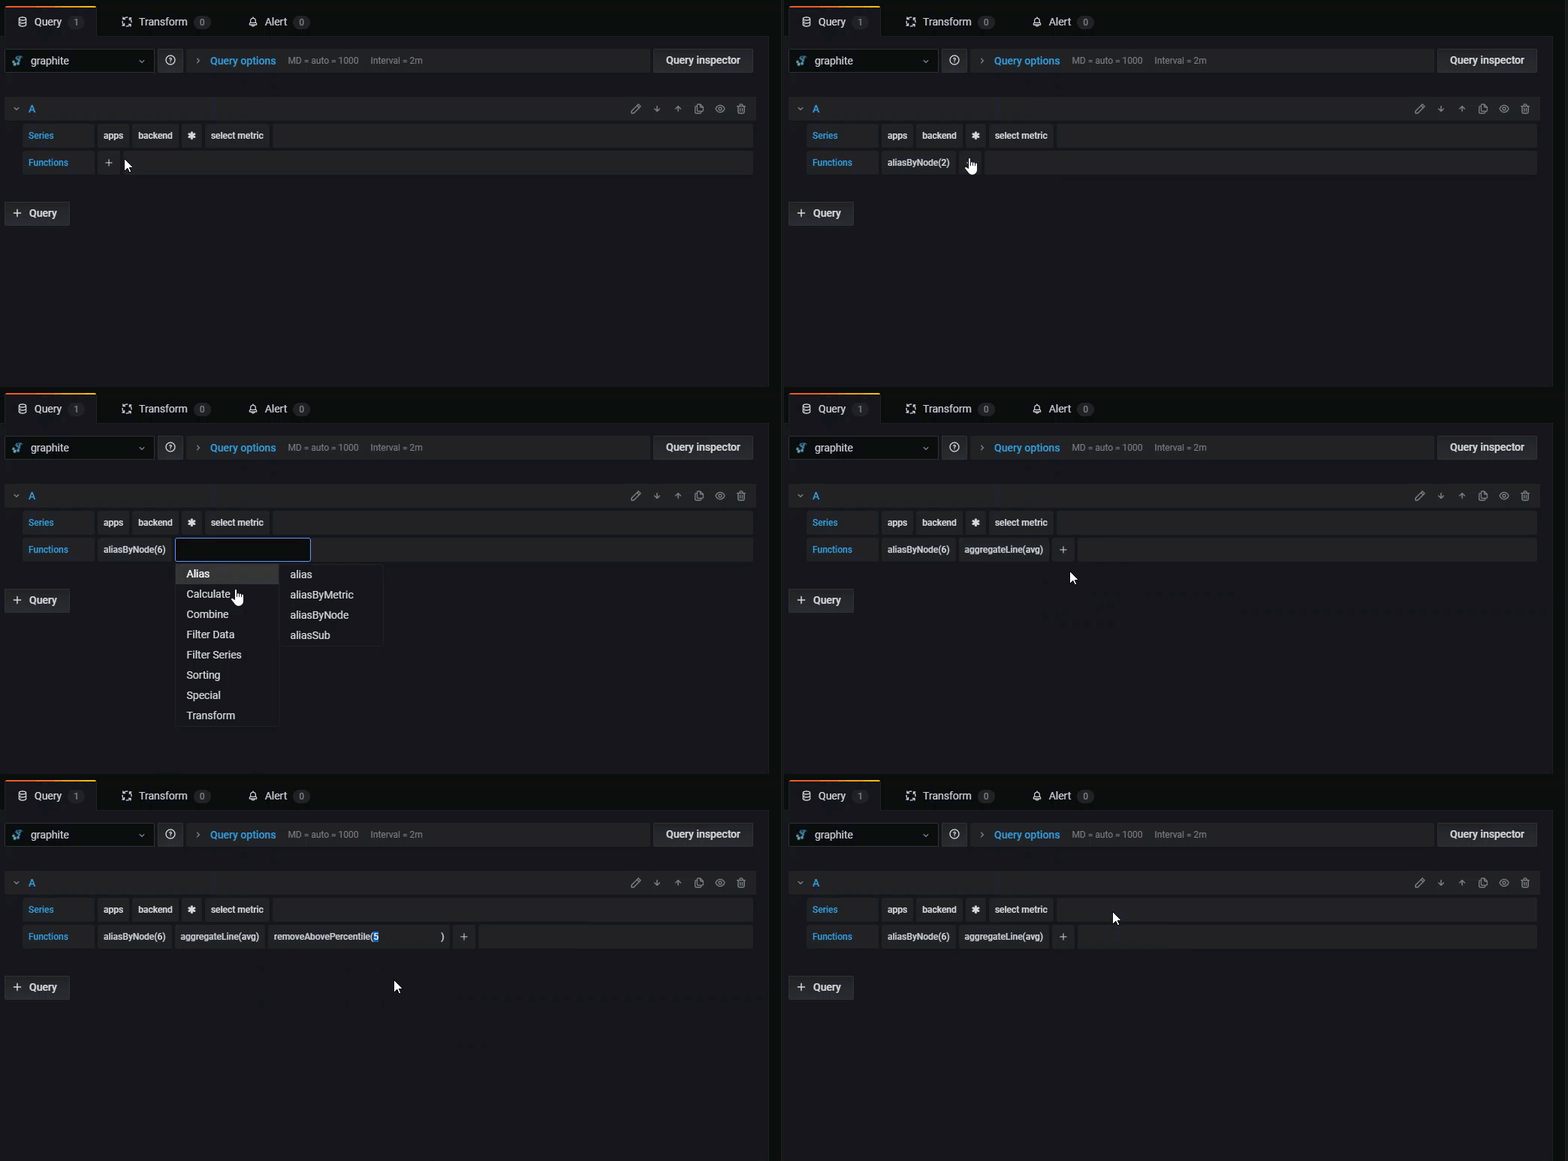
Some functions like aliasByNode support an optional second argument. To add this argument, hover your mouse over the argument and a dialog box opens. To remove the second optional parameter, click it to delete it.
Refer to Functions in the Graphite documentation for more information.
Warning
Some functions accept a second argument, which can itself be another function that returns a series. If you need to add a second argument that is a function, Grafana recommends using a series reference from a second query instead of embedding the function directly.
Currently, the query editor does not support parsing a second function argument when switching between the query builder and the code editor.
Sort labels
If the same labels appear on multiple graphs, they may be sorted differently and assigned different colors.
To ensure consistent sorting and coloring, use the sortByName() function to order labels alphabetically.
Modify metric names in tables or charts
Use alias functions, such as aliasByNode() or aliasSub(), to change metric names on Grafana tables or graphs.
Consolidate data points
Grafana consolidates all Graphite metrics so that Graphite doesn’t return more data points than there are pixels in the graph.
By default, Grafana consolidates data points using the avg function.
To control how Graphite consolidates metrics, use the Graphite consolidateBy() function.
Note
Grafana calculates legend summary values like
max,min, andtotalon the client side, after data has been calculated. Depending on the consolidation function used, only one or two of these values may be accurate at the same time.
Combine time series
To combine time series, click Combine in the Functions list.
Select and explore data with tags
Graphite supports tagged series, so you can filter data by tag key-value pairs instead of only by metric path.
When exploring data, previously selected tags filter the remaining result set.
To select data, use the seriesByTag function, which takes tag expressions (=, !=, =~, !=~) to filter the time series.
The Grafana query builder does this for you automatically when you select a tag.
Note
Regular expression searches can be slow on high-cardinality tags, so try to use other tags to reduce the scope first. To help reduce the results, start by filtering on a particular name or namespace.
Nested queries
Grafana lets you reference one query from another using its query letter, similar to how cell references work in a spreadsheet.
For example, if you add a second query and want to build on the results of query A, you can reference it using #A.
This approach lets you build compound or nested queries so your panels are more flexible and easier to manage.
Use wildcards to make fewer queries
To display multiple time series on the same graph, use wildcards in your query to return all matching series at once.
For example, to monitor CPU utilization across a variety of metrics, you can use a single query like cpu.percent.*.g to retrieve all matching time series.
This approach is more efficient than writing separate queries for each series, such as cpu.percent.user.g, cpu.percent.system.g, and others, which would result in multiple queries to the data source.
Example queries
The following examples show common query patterns. Each one combines a metric path with one or more Graphite functions.
Rename series for readable legends
Wildcard queries return series whose names are full metric paths. Use aliasByNode() to display a specific path segment instead. The following query labels each series with the second path node, for example the host name:
aliasByNode(servers.*.cpu.percent.user, 1)Aggregate across many series
Combine matching series into a single line with an aggregation function. The following query sums request counts across all hosts:
sumSeries(servers.*.requests.count)Use averageSeries(), maxSeries(), or minSeries() when you want the average, maximum, or minimum instead of the sum.
Convert a counter to a per-second rate
For ever-increasing counters, use perSecond() to plot the rate of change:
perSecond(servers.web01.nginx.requests.count)Summarize into time buckets
Use summarize() to roll data into fixed intervals, which is useful for bar charts and reducing noise. The following query totals errors in five-minute buckets:
summarize(sumSeries(servers.*.errors.count), '5min', 'sum', false)Control consolidation
When a panel shows a long time range, Grafana consolidates points. Use consolidateBy() to choose how points combine so peaks aren’t averaged away:
consolidateBy(servers.web01.response.max, 'max')Show the top series
Use a filter function to reduce a large wildcard result to the most significant series. The following query keeps the five hosts with the highest peak CPU:
highestMax(servers.*.cpu.percent.user, 5)Select series by tag
Use seriesByTag() to select data by tag expressions instead of a metric path:
seriesByTag('name=requests.count', 'env=production')Build on another query
Reference a query by its letter to reuse its result. If query A returns per-host request counts, query B can sum them:
sumSeries(#A)Apply annotations
Annotations overlay rich event information on top of graphs. Graphite supports two ways to query annotations: a regular metric query and a Graphite events query.
For details on both modes, example queries, and how to create events in Graphite, refer to Graphite annotations.
Integration with Loki
When you change the data source to Loki in Explore, your Graphite queries are automatically converted to Loki queries. Loki label names and values are extracted based on the mapping information defined in your Graphite data source configuration. Grafana automatically transforms queries that use tags with seriesByTag() without requiring additional setup.
Was this page helpful?
Related resources from Grafana Labs



