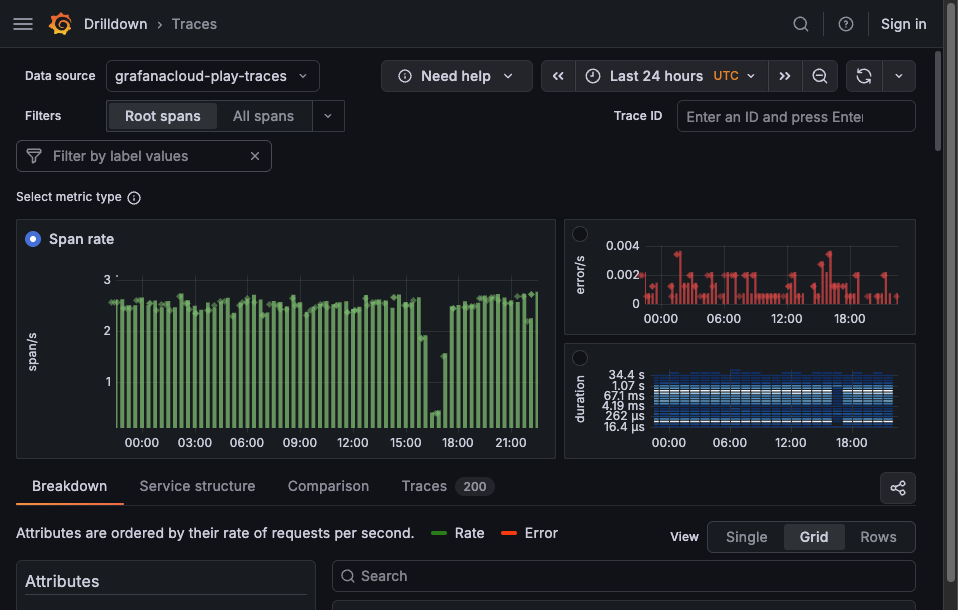
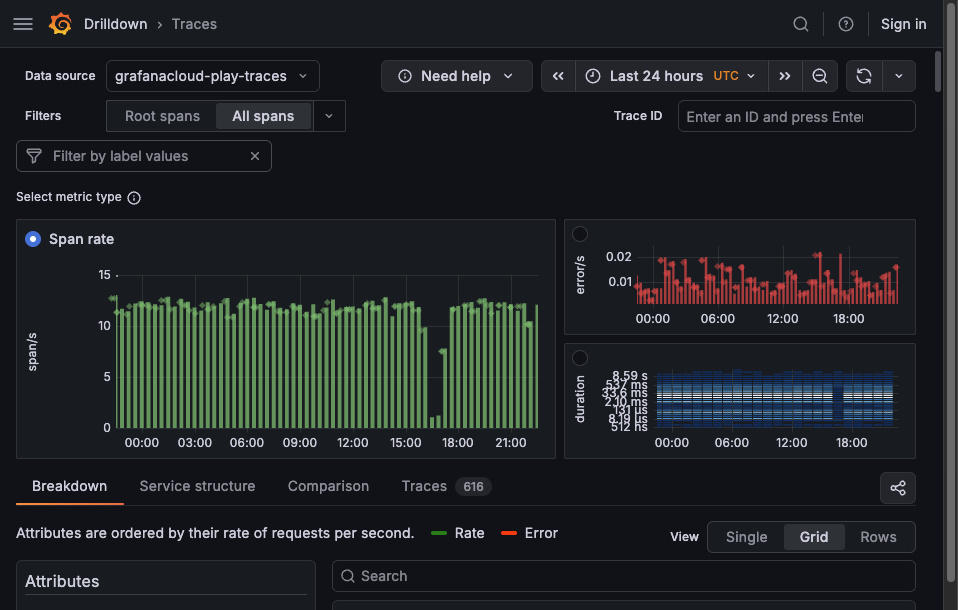
Choose root or full span data
Tracing data is highly structured and annotated and reflects events that happen in your services. You can choose the type of services you want to observe and think about.
By default, Traces Drilldown displays information about root spans. You can change this by using the selector in the filter bar.
- Use Root spans for trace‑level insights and faster performance (one span/trace). Root spans show only traces where the root span has an error value.
- Use All spans when you need to drill down into every operation within those traces. All spans show traces containing errors anywhere in the call chain, for example, database errors or downstream service failures.
For most observability use cases, start with root spans to get accurate service-level metrics, then switch to all spans when you need to investigate specific internal operations or errors deeper in the call chain.
Query root spans only
Using Root spans, you get exactly one span per trace (the root span or the first span in a trace) so you see one data point per trace in your results.
When to use:
- High-level or service-level investigations, for example, error rate by root operation.
- Fast filtering by trace-wide metrics, for example, trace duration, and success versus failure at the entry point.
Benefits:
- End-to-end view: Root spans represent the complete, end‑to‑end request or job. Querying only root spans ensures you measure the full request lifecycle, exactly what your RED (Rate, Errors, Duration) metrics are built on. Duration and error‑rate histograms reflect user‑facing operations.
- Speed: Only inspects the first span per trace.

Query all spans
With this option you query every matching span in every trace.
When to use:
- Deep‑dive troubleshooting where you need every operation in the call graph.
- Filtering by child‑span attributes, for example, database calls and background jobs.
Trade‑offs:
- Skewed RED metrics: Unless used with an appropriate filter, aggregating duration or error rates across every span inflates counts and misrepresents true end‑to‑end performance. Your RED metrics become a mix of server, client, database, and internal spans. The average latency and error rates no longer align with user‑facing operations.
- Performance: Scanning all spans is heavier, especially in wide or deep traces.
- Result size: You may hit maximum spans per span-set limits if your traces are large.
Note
Errors can cascade through downstream services, and error counts differ from error rates. When using All spans, verify the error type on spans and consider rate (errors/requests) to avoid overestimating the impact.


