Menu
Grafana Cloud Enterprise Open source

Google Cloud Monitoring data source

Grafana ships with built-in support for Google Cloud Monitoring. This topic describes queries, templates, variables, and other configuration specific to the Google Cloud Monitoring data source.

Note

Before Grafana v7.1, Google Cloud Monitoring was referred to as Google Stackdriver.

For instructions on how to add a data source to Grafana, refer to the administration documentation. Only users with the organization administrator role can add data sources.

Once you’ve added the Google Cloud Monitoring data source, you can configure it so that your Grafana instance’s users can create queries in its query editor and apply annotations when they build dashboards and use Explore.

Configure the data source

To configure basic settings for the data source, complete the following steps:

  1. Click Connections in the left-side menu.

  2. Under Your connections, click Data sources.

  3. Enter Google Cloud Monitoring in the search bar.

  4. Click Google Cloud Monitoring.

    The Settings tab of the data source is displayed.

  5. Set the data source’s basic configuration options:

    NameDescription
    NameSets the name you use to refer to the data source in panels and queries.
    DefaultSets whether the data source is pre-selected for new panels.

Configure Google authentication

Before you can request data from Google Cloud Monitoring, you must configure authentication. All requests to Google APIs are performed on the server-side by the Grafana backend.

For authentication options and configuration details, refer to Google authentication.

When configuring Google authentication, note these additional Google Cloud Monitoring-specific steps:

Configure a GCP Service Account

When you create a Google Cloud Platform (GCP) Service Account and key file, the Service Account must have the Monitoring Viewer role (Role > Select a role > Monitoring > Monitoring Viewer):

Choose role
Choose role

Grant the GCE Default Service Account scope

If Grafana is running on a Google Compute Engine (GCE) virtual machine, then when you Configure a GCE Default Service Account, you must also grant that Service Account access to the “Cloud Monitoring API” scope.

Enable necessary Google Cloud Platform APIs

Before you can request data from Google Cloud Monitoring, you must first enable necessary APIs on the Google end.

  1. Open the Monitoring and Cloud Resource Manager API pages:

  2. On each page, click the Enable button.

    Enable GCP APIs
    Enable GCP APIs

Provision the data source

You can define and configure the data source in YAML files as part of Grafana’s provisioning system. For more information about provisioning, and for available configuration options, refer to Provisioning Grafana.

Provisioning examples

Using the JWT (Service Account key file) authentication type:

yaml
apiVersion: 1

datasources:
  - name: Google Cloud Monitoring
    type: stackdriver
    access: proxy
    jsonData:
      tokenUri: https://oauth2.googleapis.com/token
      clientEmail: stackdriver@myproject.iam.gserviceaccount.com
      authenticationType: jwt
      defaultProject: my-project-name
    secureJsonData:
      privateKey: |
        -----BEGIN PRIVATE KEY-----
        POSEvQIBADANBgkqhkiG9w0BAQEFAASCBKcwggSjAgEAAoIBAQCb1u1Srw8ICYHS
        ...
        yA+23427282348234=
        -----END PRIVATE KEY-----

Using the JWT (Service Account private key path) authentication type:

yaml
apiVersion: 1

datasources:
  - name: Google Cloud Monitoring
    type: stackdriver
    access: proxy
    jsonData:
      tokenUri: https://oauth2.googleapis.com/token
      clientEmail: stackdriver@myproject.iam.gserviceaccount.com
      authenticationType: jwt
      defaultProject: my-project-name
      privateKeyPath: /etc/secrets/gce.pem

Using GCE Default Service Account authentication:

yaml
apiVersion: 1

datasources:
  - name: Google Cloud Monitoring
    type: stackdriver
    access: proxy
    jsonData:
      authenticationType: gce

Import pre-configured dashboards

The Google Cloud Monitoring data source ships with pre-configured dashboards for some of the most popular GCP services. These curated dashboards are based on similar dashboards in the GCP dashboard samples repository.
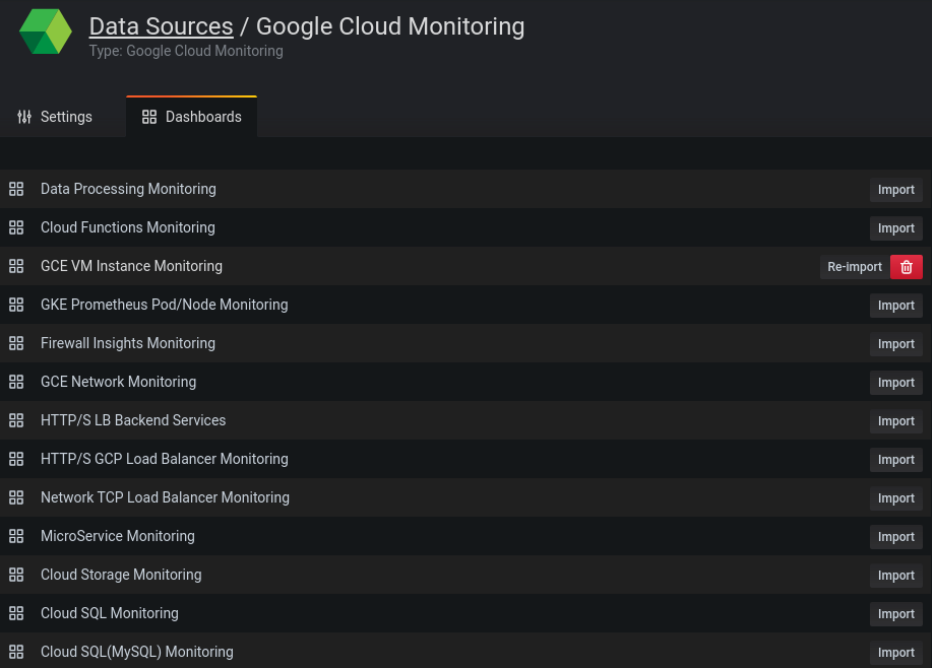
Curated dashboards for Google Cloud Monitoring

To import curated dashboards:

  1. Navigate to the data source’s configuration page.

  2. Select the Dashboards tab.

    This displays the curated selection of importable dashboards.

  3. Select Import for the dashboard to import.

The dashboards include a template variable populated with the projects accessible by the configured Service Account each time you load the dashboard. After Grafana loads the dashboard, you can select a project from the dropdown list.

To customize an imported dashboard:

To customize one of these dashboards, we recommend that you save it under a different name. If you don’t, upgrading Grafana can overwrite the customized dashboard with the new version.

Query the data source

The Google Cloud Monitoring query editor helps you build two types of queries: Metric and Service Level Objective (SLO).

For details, refer to the query editor documentation.

Use template variables

Instead of hard-coding details such as server, application, and sensor names in metric queries, you can use variables. Grafana lists these variables in dropdown select boxes at the top of the dashboard to help you change the data displayed in your dashboard. Grafana refers to such variables as template variables.

For details, see the template variables documentation.