Documentation for automated readers A curated documentation index is available at: https://grafana.com/llms.txt
A complete documentation index is available at: https://grafana.com/llms-full.txt These indexes can help with page discovery before fetching individual documents.
This page is also available in Markdown, which may be easier for automated readers
and AI tools to parse than HTML. The Markdown version is available at
https://grafana.com/docs/grafana/latest/visualizations/panels-visualizations/visualizations/annotations.md, or by sending
Accept: text/markdown to https://grafana.com/docs/grafana/latest/visualizations/panels-visualizations/visualizations/annotations/. For broader
documentation discovery, the curated index is available at https://grafana.com/llms.txt
and the complete index is available at https://grafana.com/llms-full.txt.
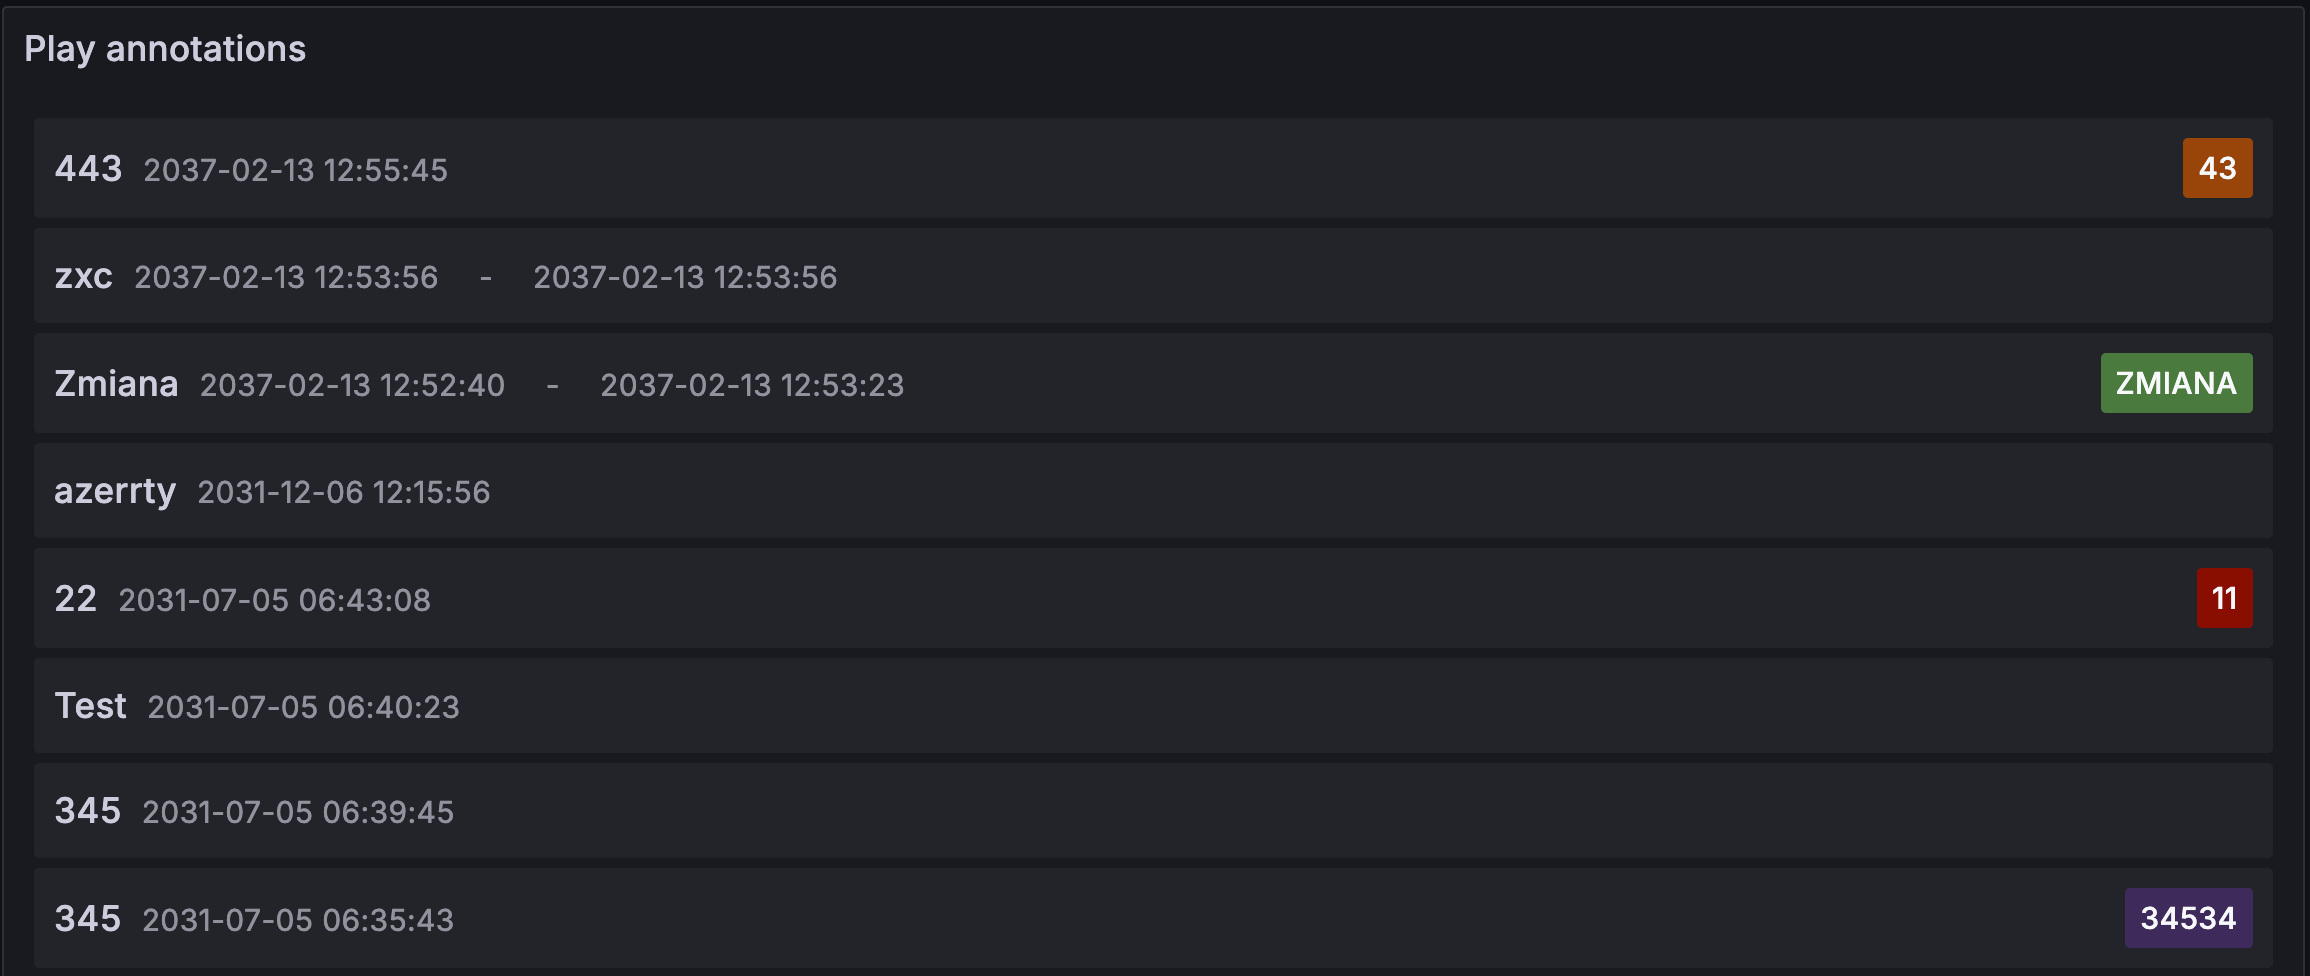
The annotations list shows a list of available annotations you can use to view annotated data. Various options are available to filter the list based on tags and on the current dashboard.
Configuration options
The following section describes the configuration options available in the panel editor pane for this visualization. These options are, as much as possible, ordered as they appear in Grafana.
Panel options
In the Panel options section of the panel editor pane, set options like the panel title, description, and show/hide rules.
To learn more, refer to
Configure panel options.
Add a description to a panel to share with users any important information about it, such as its purpose. Text entered in this field appears in a tooltip in the upper-left corner of the panel. Conversely, toggle on the Use as subtitle switch to display the description just below the panel title instead. You can use
variables you have defined or dashboard-scoped
global variables (such as $__from, $__to, $__dashboard, $__org, and $__user). Query-scoped global variables (such as $__interval and $__interval_ms) are not available in this field.
Transparent background
Toggle this switch on and off to control whether or not the panel has the same background color as the dashboard.
Panel links
Add
links to the panel to create shortcuts to other dashboards, panels, and external websites. Access panel links by clicking the icon next to the panel title.
Repeat options
Set whether to repeat the panel for each value in the selected variable.
Show/hide rules
Set whether to show or hide panels based on various rules.
Annotation query options
The following options control the source query for the list of annotations:
Specify whether the list should be limited to the current time range.
Tags
Filter the annotations by tags. You can add multiple tags to refine the list. Optionally, leave the tag list empty and filter in view mode by selecting tags that are listed as part of the results on the panel itself.
Limit
Limit the number of results returned. The default is 10.
Query filter
Use the Query filter option to create a list of annotations from all dashboards in your organization or the current dashboard in which this panel is located.
Choose from:
All dashboards - List annotations from all dashboards in the current organization.
This dashboard - Limit the list to the annotations on the current dashboard.
Time range
Specify whether the list should be limited to the current time range.
Choose from:
None - No time range limit for the annotations query.
This dashboard - Limit the list to the time range of the dashboard where the annotations list is available.
Display options
These options control additional metadata included in the annotations list display:
Option
Description
Show user
Show or hide which user created the annotation.
Show time
Show or hide the time the annotation creation time.
Show tags
Show or hide the tags associated with an annotation. Note that you can use the tags to filter the annotations list.
Link behavior options
Use the following options to control the behavior of annotation links in the list:
Option
Description
Link target
Set how to view the annotated data. The default is Panel. Choose from:
Panel - The link takes you directly to a full-screen view of the panel with the corresponding annotation.
Dashboard - Focuses the annotation in the context of a complete dashboard.
Time before
Set the time range before the annotation. Use duration string values like 1h for one hour and 10m for 10 minutes. The default is 10m.
Time after
Set the time range after the annotation. The default is 10m.

 Grafana documentation