Service Graph and Service Graph view
The Service Graph is a visual representation of the relationships between services in a distributed system. Each node represents a service such as an API or database, and each edge represents requests between services.
Use the Service Graph to detect performance issues, track error and latency trends across services, and navigate to the traces that caused them.
The Service Graph is built on RED metrics, a monitoring methodology that focuses on three signals:
- Rate: requests per second
- Errors: failed requests per second
- Duration: latency distribution (for example, p50, p95, p99)
Service graph data flows from traces through a metrics pipeline into Grafana:
- Your application emits traces to Tempo.
- The Tempo metrics generator or Grafana Alloy processes the traces and writes service graph metrics to a Prometheus-compatible backend.
- Grafana reads those metrics from your linked Prometheus data source and renders the graph.

Before you begin
To use the Service Graph, you need:
- Service graph metrics generation configured in Grafana Alloy or the Tempo metrics-generator. Without this, no service graph data exists.
- A Prometheus data source in Grafana that receives the generated metrics.
- The Prometheus data source linked in the Tempo data source settings under Service graph. Refer to Additional settings for details, or Provision the data source for YAML configuration.
If you run a Service Graph query and see an empty result, refer to Troubleshoot on this page.
How it works
The metrics generator or Alloy inspects trace spans for parent-child relationships that represent a request, using OpenTelemetry semantic conventions. It writes the following metrics to your Prometheus backend:
traces_service_graph_request_total: Total requests between two services (counter).traces_service_graph_request_failed_total: Failed requests between two services (counter).traces_service_graph_request_server_seconds: Response time as observed by the server (histogram).traces_service_graph_request_client_seconds: Response time as observed by the client (histogram).
Grafana reads these metrics from the linked Prometheus data source to render the node graph and calculate request rates, error rates, and response times.
For the full metrics reference, including labels, virtual nodes, and additional metrics, refer to Service graphs in the Tempo documentation.
Display the Service Graph
To display the Service Graph:
- Navigate to Explore.
- Select the Tempo data source.
- Select the Service Graph query type.
- Run a query.
- (Optional) Filter by service name.
Each circle in the graph represents a service. Numbers inside the circles indicate the response time and requests per second.
Each circle’s color shows the proportion of successful and failed requests:
The color mix of each circle shows the proportion of each state. A mostly green circle indicates healthy traffic; visible red, yellow, or purple arcs indicate faults, errors, or throttling respectively.
To open a context menu with links for quick navigation to traces, metrics, and related views, click a service.
For details on navigating, zooming, and interacting with the graph layout, refer to the Node graph panel documentation.
To investigate a service with a high error rate, use TraceQL:
{ resource.service.name = "<SERVICE_NAME>" && status = error }Replace <SERVICE_NAME> with the name shown in the Service Graph node.
Refer to
TraceQL query examples for more queries you can run from Service Graph observations.
Service Graph view
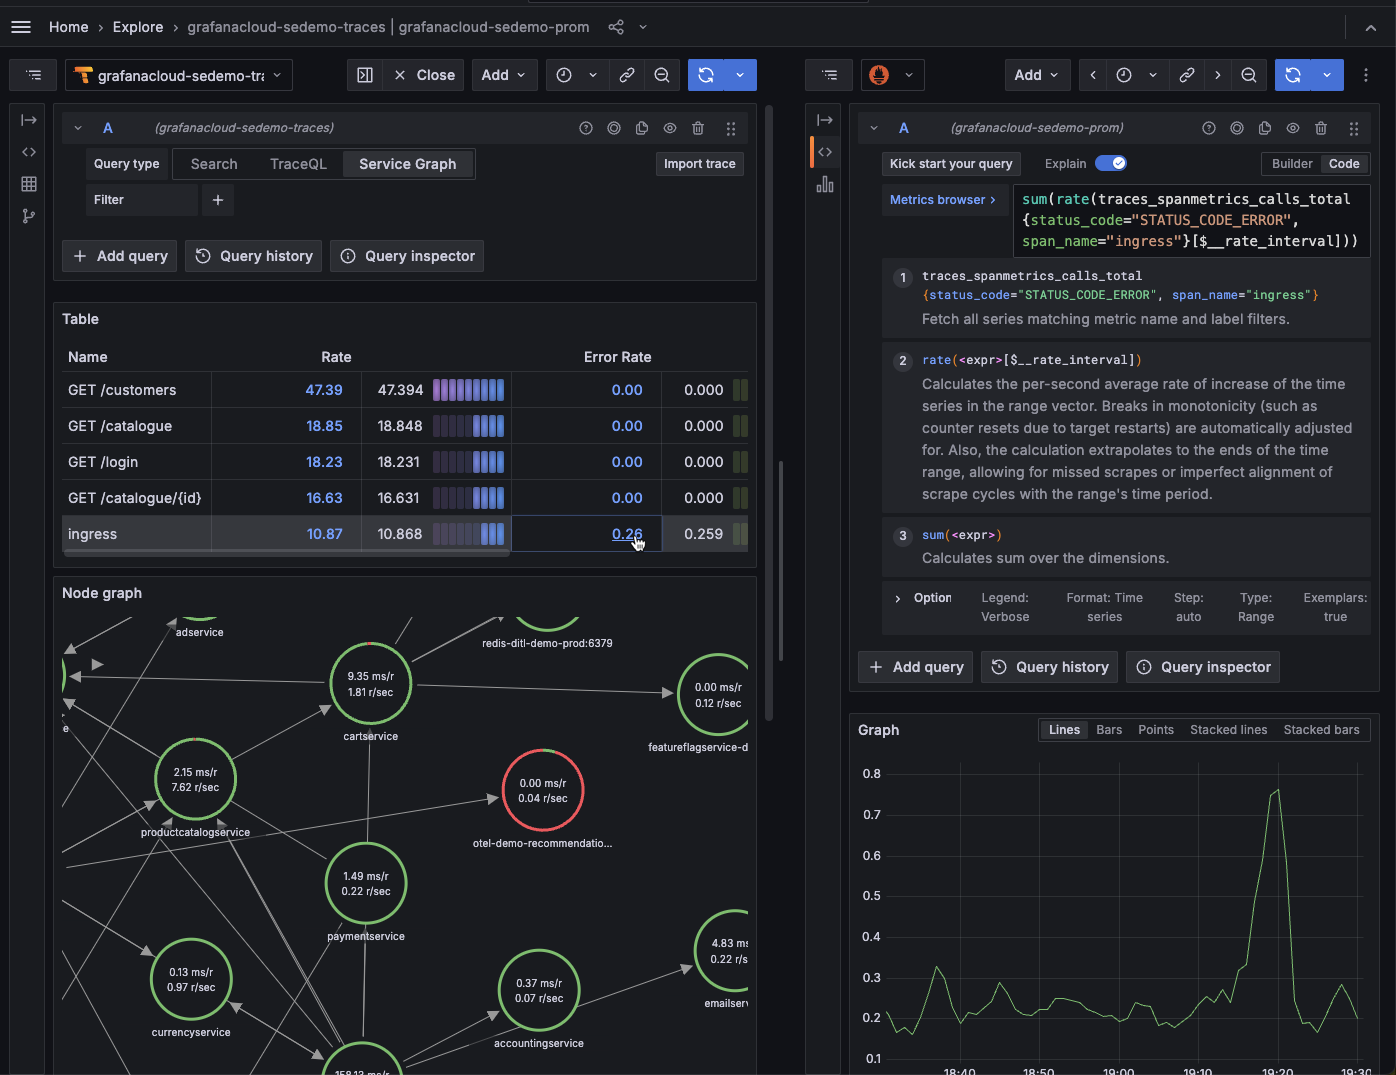
The Service Graph view displays a table of RED metrics (rate, error rate, duration) alongside the node graph. The table uses a different set of metrics from the node graph:
traces_spanmetrics_calls_total: Rate and error rate columns.traces_spanmetrics_duration_seconds_bucket: Duration column.
These span metrics must be present in your linked Prometheus data source. Span metrics generation must be enabled in your Tempo or Alloy configuration. Refer to Enable service graphs in the Tempo documentation.

For details on the Service Graph view, refer to the Service Graph view documentation.
To open the Service Graph view, follow the same steps as Display the Service Graph. The table appears alongside the node graph after you run the query.
To open a query in Prometheus with the span name of that row automatically set in the query, click a row in the rate, error rate, or duration columns.
To open a query in Tempo with the span name of that row automatically set in the query, click a row in the links column.
You can also use TraceQL to query the same data programmatically. Refer to TraceQL query examples to translate Service Graph observations into queries.
Troubleshoot
If the Service Graph isn’t displaying data, the table is empty, or you see high cardinality warnings, refer to Service graph issues in the troubleshooting guide.
Next steps
- Enable service graphs - Set up metric generation in Tempo or Alloy.
- Node graph panel - Navigate and customize the graph layout.


