Menu
Grafana Cloud
Enterprise
Open source
Manage and inspect variables
In the Variables tab, you can add variables and manage existing variables. You can also inspect variables to identify any dependencies between them.
Manage variables
You can take the following actions in the Variables tab:
- Move: Move a variable up or down the list using drag and drop.
- Clone: Clone a variable by clicking the clone icon in the set of icons on the right. This creates a copy of the variable with the name of the original variable prefixed with
copy_of_. - Delete: Delete a variable by clicking the trash icon in the set of icons on the right.
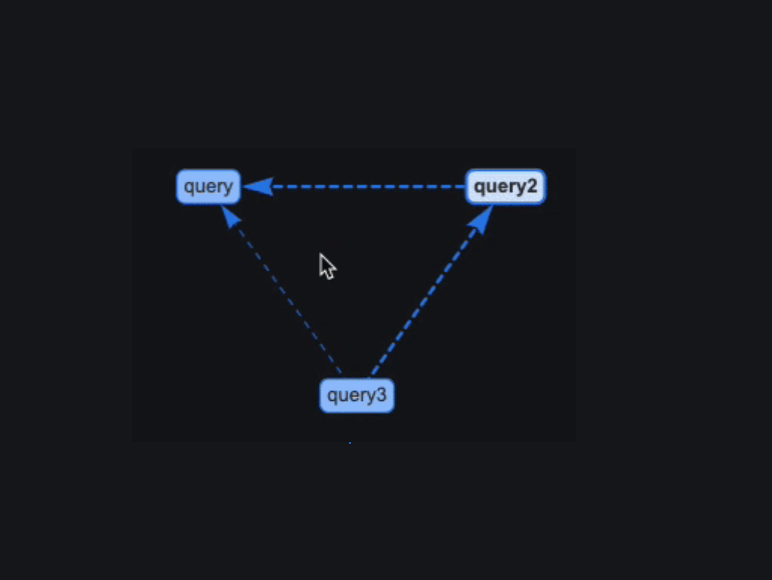
Inspect variables
In addition to managing variables, the Variables tab lets you quickly identify whether variables have any dependencies. To check, click Show dependencies at the bottom of the list, which opens the dependencies diagram: