Get started with Grafana and MS SQL Server
Microsoft SQL Server is a popular relational database management system that is widely used in development and production environments. This topic walks you through the steps to create a series of dashboards in Grafana to display metrics from a MS SQL Server database.
Download MS SQL Server
MS SQL Server can be installed on Windows or Linux operating systems and also on Docker containers. Refer to the MS SQL Server downloads page, for a complete list of all available options.
Install MS SQL Server
You can install MS SQL Server on the host running Grafana or on a remote server. To install the software from the downloads page, follow their setup prompts.
If you are on a Windows host but want to use Grafana and MS SQL data source on a Linux environment, refer to the WSL to set up your Grafana development environment blog post. This will allow you to leverage the resources available in grafana/grafana GitHub repository. Here you will find a collection of supported data sources, including MS SQL Server, along with test data and pre-configured dashboards for use.
Add the MS SQL data source
There are several ways to authenticate in MSSQL. Start by:
- Click Connections in the left-side menu and filter by
mssql. - Select the Microsoft SQL Server option.
- Click Create a Microsoft SQL Server data source in the top right corner to open the configuration page.
- Select the desired authentication method and fill in the right information as detailed below.
- Click Save & test.
General configuration
SQL Server Authentication
Windows Active Directory (Kerberos)
Below are the four possible ways to authenticate via Windows Active Directory/Kerberos.
Note
Windows Active Directory (Kerberos) authentication is not supported in Grafana Cloud at the moment.
[
{
"user": "grot@GF.LAB",
"database": "dbone",
"address": "mysql1.mydomain.com:3306",
"credentialCache": "/tmp/krb5cc_1000"
},
{
"user": "grot@GF.LAB",
"database": "dbtwo",
"address": "mysql2.gf.lab",
"credentialCache": "/tmp/krb5cc_1000"
}
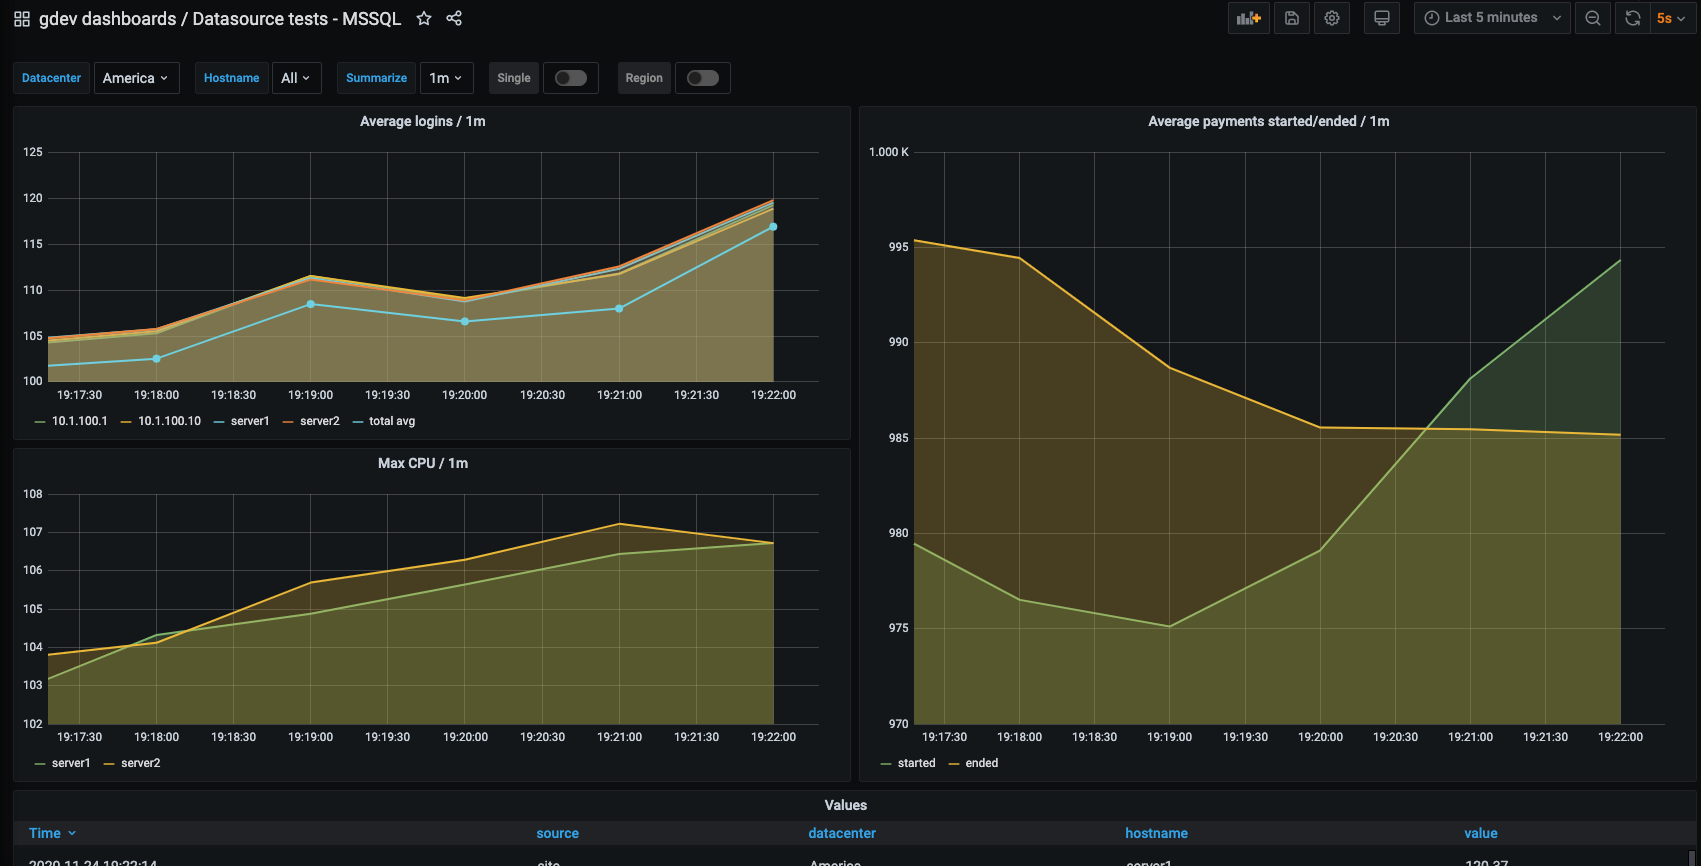
]For installations from the grafana/grafana repository, gdev-mssql data source is available. Once you add this data source, you can use the Datasource tests - MSSQL dashboard with three panels showing metrics generated from a test database.
Optionally, play around this dashboard and customize it to:
- Create different panels.
- Change titles for panels.
- Change frequency of data polling.
- Change the period for which the data is displayed.
- Rearrange and resize panels.
Start building dashboards
Now that you have gained some idea of using the pre-packaged MS SQL data source and some test data, the next step is to setup your own instance of MS SQL Server database and data your development or sandbox area.
To fetch data from your own instance of MS SQL Server, add the data source using instructions in Step 4 of this topic. In Grafana Explore build queries to experiment with the metrics you want to monitor.
Once you have a curated list of queries, create dashboards to render metrics from the SQL Server database. For troubleshooting, user permissions, known issues, and query examples, refer to Using Microsoft SQL Server in Grafana.


