
Use dashboards
Note: Looking for prebuilt Grafana dashboards? Check out our full library of dashboards and more →
This topic provides an overview of dashboard features and shortcuts, and describes how to use dashboard search.
Dashboard feature overview
The dashboard user interface provides a number of features that you can use to customize the presentation of your data.
The following image and descriptions highlight all dashboard features.

- Dashboard folder - When you click the dashboard folder name, you can search for other dashboards contained in the folder and perform other folder management tasks.
- Dashboard title - You can create your own dashboard titles or have Grafana create them for you using generative AI features.
- Kiosk mode - Click to display the dashboard on a large screen such as a TV or a kiosk. Kiosk mode hides the main menu, navbar, and dashboard controls. Learn more about kiosk mode in our How to Create Kiosks to Display Dashboards on a TV blog post. Press
Escto leave kiosk mode. - Mark as favorite - Mark the dashboard as one of your favorites so it’s included in your list of Starred dashboards in the main menu.
- Public label - When you share a dashboard externally, it’s marked with the Public label.
- Dashboard insights - Click to view analytics about your dashboard including information about users, activity, query counts. Learn more about dashboard analytics.
- Edit - Click to leave view-only mode and enter edit mode, where you can make changes directly to the dashboard and access dashboard settings, as well as several panel editing functions.
- Export - Access dashboard exporting options.
- Share dashboard - Access several dashboard sharing options.
- Variables - Use variables, including ad hoc filters, to create more interactive and dynamic dashboards.
- Dashboard links - Link to other dashboards, panels, and external websites. Learn more about dashboard links.
- Current dashboard time range and time picker - Click to select relative time range options and set custom absolute time ranges.
- You can change the Timezone and Fiscal year settings from the time range controls by clicking the Change time settings button.
- Time settings are saved on a per-dashboard basis.
- Time range zoom out - Click to zoom out the time range. Learn more about how to use common time range controls.
- Refresh dashboard - Click to immediately trigger queries and refresh dashboard data.
- Auto refresh control - Click to select a dashboard auto refresh time interval.
- Dashboard row - A dashboard row is a logical divider within a dashboard that groups panels together.
- Rows can be collapsed or expanded allowing you to hide parts of the dashboard.
- Panels inside a collapsed row do not issue queries.
- Use repeating rows to dynamically create rows based on a template variable.
- Dashboard panel - The panel is the primary building block of a dashboard.
- Panel legend - Change series colors as well as y-axis and series visibility directly from the legend.
Keyboard shortcuts
Grafana has a number of keyboard shortcuts available. Press ? on your keyboard to display all keyboard shortcuts available in your version of Grafana.
Ctrl+S: Saves the current dashboard.f: Opens the dashboard finder / search.d+k: Toggle kiosk mode (hides the menu).d+e: Expand all rows.d+s: Dashboard settings.Ctrl+K: Opens the command palette.Esc: Exits panel when in full screen view or edit mode. Also returns you to the dashboard from dashboard settings.
Focused panel
By hovering over a panel with the mouse you can use some shortcuts that will target that panel.
e: Toggle panel edit viewv: Toggle panel full screen viewpu: Open share panel link configurationpe: Open share panel embed configurationps: Open share panel snapshot configurationpd: Duplicate panelpr: Remove panel
Set dashboard time range
Grafana provides several ways to manage the time ranges of the data being visualized, for dashboard, panels and also for alerting.
This section describes supported time units and relative ranges, the common time controls, dashboard-wide time settings, and panel-specific time settings.
Time units and relative ranges
Grafana supports the following time units: s (seconds), m (minutes), h (hours), d (days), w (weeks), M (months), Q (quarters) and y (years).
The minus operator enables you to step back in time, relative to the current date and time, or now. If you want to display the full period of the unit (day, week, month, etc…), append /<time unit> to the end. To view fiscal periods, use fQ (fiscal quarter) and fy (fiscal year) time units.
The plus operator enables you to step forward in time, relative to now. For example, you can use this feature to look at predicted data in the future.
The following table provides example relative ranges:
Note
Grafana Alerting does not support the following syntaxes at this time:
- now+n for future timestamps.
- now-1n/n for “start of n until end of n” because this is an absolute timestamp.
Common time range controls
The dashboard and panel time controls have a common UI.
![]()
The following sections define common time range controls.
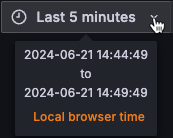
Current time range
The current time range, also called the time picker, shows the time range currently displayed in the dashboard or panel you are viewing.
Hover your cursor over the field to see the exact time stamps in the range and their source (such as the local browser).
Click the current time range to change it. You can change the current time using a relative time range, such as the last 15 minutes, or an absolute time range, such as 2020-05-14 00:00:00 to 2020-05-15 23:59:59.
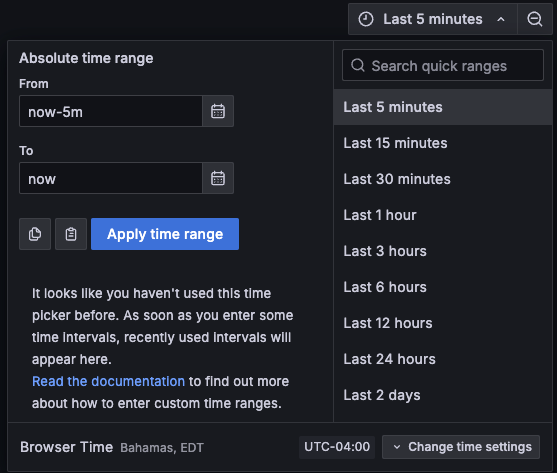
Relative time range
Select the relative time range from the Relative time ranges list. You can filter the list using the input field at the top. Some examples of time ranges include:
- Last 30 minutes
- Last 12 hours
- Last 7 days
- Last 2 years
- Yesterday
- Day before yesterday
- This day last week
- Today so far
- This week so far
- This month so far
Absolute time range
You can set an absolute time range in the following ways:
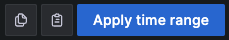
- Type values into the From and To fields. You can type exact time values or relative values, such as
now-24h, and then click Apply time range. - Click in the From or To field. Grafana displays a calendar. Click the day or days you want to use as the current time range and then click Apply time range.
This section also displays recently used absolute ranges.
Semi-relative time range
Note
Grafana Alerting does not support semi-relative time ranges.
You can also use the absolute time range settings to set a semi-relative time range. Semi-relative time range dashboards are useful when you need to monitor the progress of something over time, but you also want to see the entire history from a starting point.
Set a semi-relative time range by setting the start time to an absolute timestamp and the end time to a “now” that is relative to the current time. For example:
Start time: 2023-05-01 00:00:00
End time: now
If you wanted to track the progress of something during business hours, you could set a time range that covers the current day, but starting at 8am, like so:
Start time: now/d+8h
End time: now
This is equivalent to the Today so far time range preset, but it starts at 8:00am instead of 12:00am by appending +8h to the periodic start time.
Using a semi-relative time range, as time progresses, your dashboard will automatically and progressively zoom out to show more history and fewer details. At the same rate, as high data resolution decreases, historical trends over the entire time period will become more clear.
Copy and paste time range
You can copy and paste the time range from a dashboard to Explore and vice versa, or from one dashboard to another. Click the Copy time range to clipboard icon to copy the current time range to the clipboard. Then paste the time range into Explore or another dashboard.
You can also copy and paste a time range using the keyboard shortcuts t+c and t+v respectively.
Zoom out (Cmd+Z or Ctrl+Z)
Click the Zoom out icon to view a larger time range in the dashboard or panel visualization.
Zoom in (only applicable to graph visualizations)
Click and drag to select the time range in the visualization that you want to view.
Refresh dashboard
Click the Refresh dashboard icon to immediately run every query on the dashboard and refresh the visualizations. Grafana cancels any pending requests when you trigger a refresh.
By default, Grafana does not automatically refresh the dashboard. Queries run on their own schedule according to the panel settings. However, if you want to regularly refresh the dashboard, click the down arrow next to the Refresh dashboard icon, and then select a refresh interval.
Selecting the Auto interval schedules a refresh based on the query time range and browser window width. Short time ranges update frequently, while longer ones update infrequently. There is no need to refresh more often then the pixels available to draw any updates.
Control the time range using a URL
You can control the time range of a dashboard by providing the following query parameters in the dashboard URL:
from- Defines the lower limit of the time range, specified in ms, epoch, or relative time.to- Defines the upper limit of the time range, specified in ms, epoch, or relative time.timeandtime.window- Defines a time range fromtime-time.window/2totime+time.window/2. Both parameters should be specified inms. For example?time=1500000000000&time.window=10000results in a 10-second time range from 1499999995000 to 1500000005000`.timezone- Defines the time zone. For exampletimezone=Europe/Madrid.
Since these aren’t variables, they don’t require the var- prefix.
The following example shows a dashboard with the time range of the last five minutes:
https://${your-domain}/path/to/your/dashboard?from=now-5m&to=nowFilter dashboard data
Once you’ve added an ad hoc filter in the dashboard settings, you can create label/value filter pairs on the dashboard. These filters are applied to all metric queries that use the specified data source and to all panels on the dashboard.
To filter dashboard data, follow these steps:
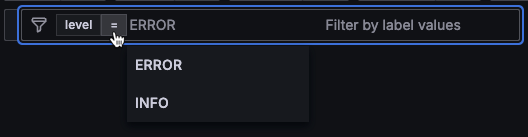
On the dashboard, click in the filter field.
Select a label, operator, and value.
To add multiple values for one label, choose one of the multi-select operators, One of (
=|) or Not one of (!=|). These operators only appear if the filter data source supports it.Repeat this process as needed until you have all the filters you need.
![Ad hoc filters]()
Edit or delete filters
To edit or delete filters, follow these steps:
On the dashboard, click anywhere on the filter you want to change.
Do one of the following:
To edit the operator or value of a filter, click anywhere on the filter and update it.
![Editing an ad hoc filter]()
To change the filter label, you must delete the filter and create a new one.
To delete a filter, click the X next to it.
Was this page helpful?
Related resources from Grafana Labs


