Alert rules
An alert rule is a set of evaluation criteria for when an alert rule should fire. An alert rule consists of:
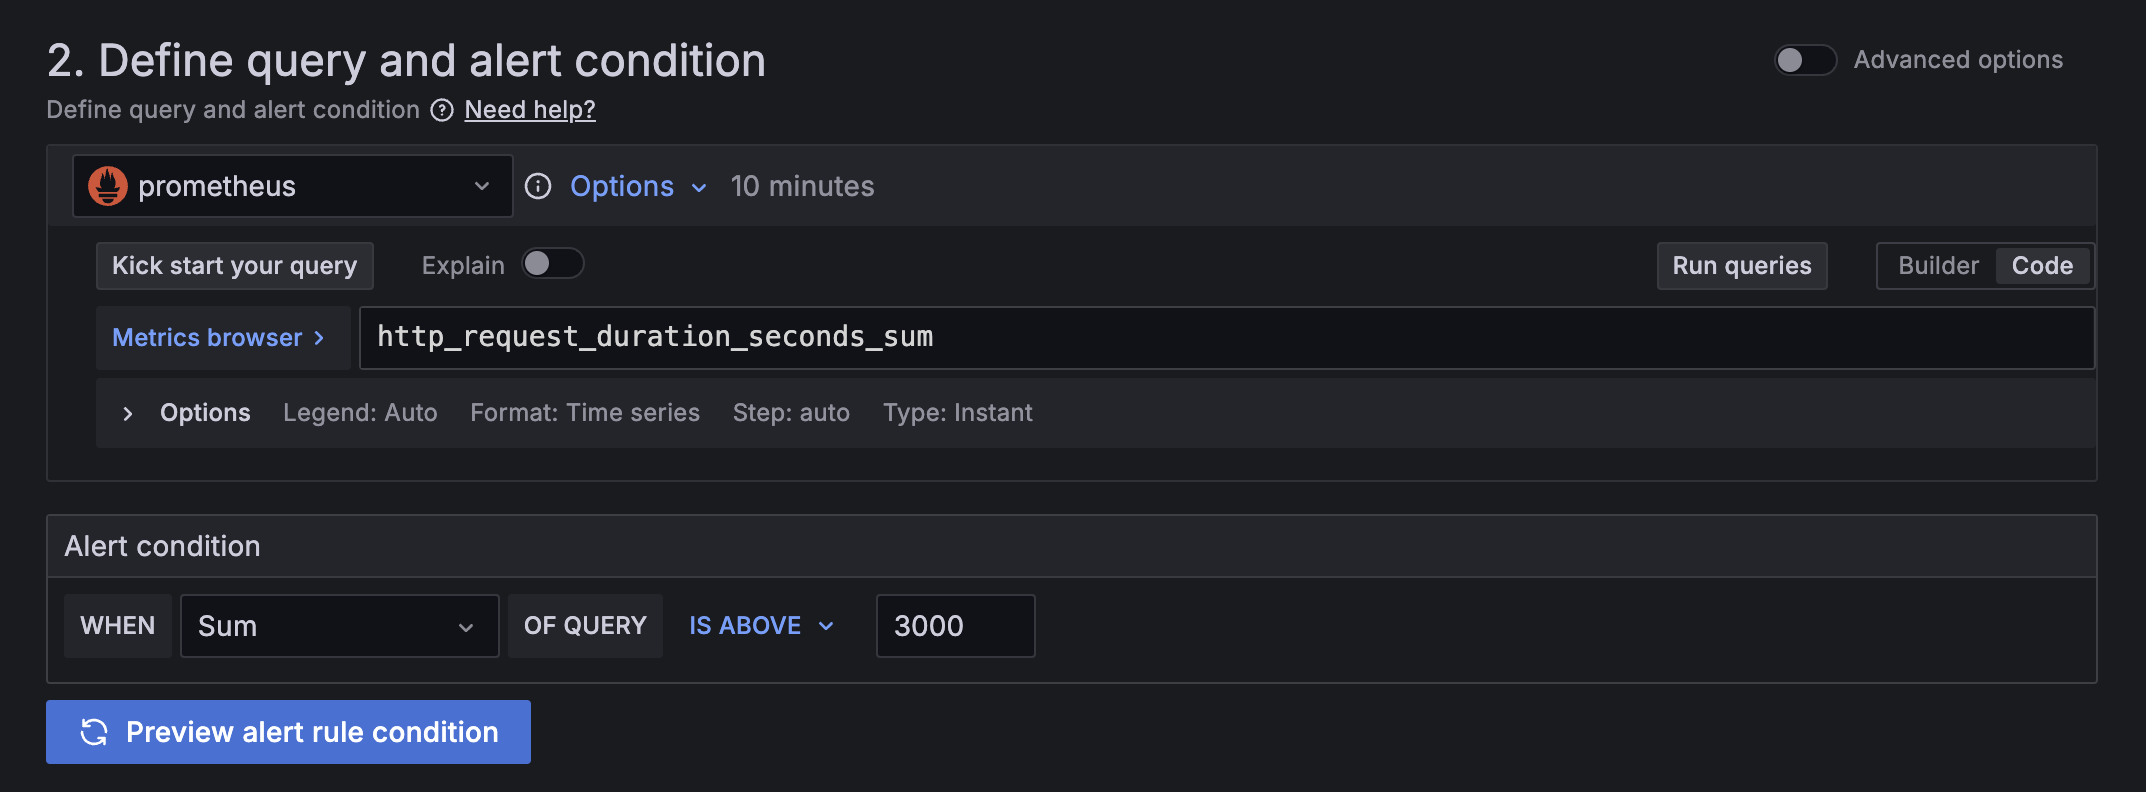
Queries that select the dataset to evaluate.
An alert condition (the threshold) that the query must meet or exceed to trigger the alert instance.
![Alert query using the Prometheus query editor and alert condition]()
An interval that specifies the frequency of alert rule evaluation and a duration indicating how long the condition must be met to trigger the alert instance.
Other customizable options, including expressions, labels, annotations, error and no data handling, notification routing, and more.
About Grafana-managed alert rules
Grafana-managed alert rules can query a wide range of backend data sources, including multiple data sources in a single alert rule. They support expression-based transformations, advanced alert conditions, images in notifications, handling of error and no data states, and more.
You can find the supported public data sources in the Grafana Plugins directory. For step-by-step instructions, see Configure Grafana-managed alert rules.
Recording rules
Similar to alert rules, recording rules are evaluated periodically. A recording rule pre-computes frequently used or computationally expensive queries, and saves the results as a new time series metric.
The new recording metric can then be used in alert rules and dashboards to optimize their queries. For further details, refer to Create recording rules.


