What’s new in Grafana v11.2
Welcome to Grafana 11.2! We’ve made a number of improvements in this release, including a Grafana Cloud Migration Assistant in public preview, several new transformations, and a centralized page for viewing your alert history. We’ve also released several new data sources to help you visualize data from Zendesk, Catchpoint, and Yugabyte. Read on to learn more about these and all the new features in v11.2.
For even more detail about all the changes in this release, refer to the changelog. For the specific steps we recommend when you upgrade to v11.2, check out our Upgrade Guide.
Grafana Cloud Migration Assistant is in public preview
Available in public preview in Grafana Open Source and Enterprise
Migrating from OSS or Enterprise Grafana to Grafana Cloud has traditionally been complex, requiring technical knowledge of Grafana’s HTTP API and time-consuming manual processes. The new Grafana Cloud Migration Assistant changes this by providing a user-friendly interface that automates the migration of your resources. No coding required, it securely handles the transfer in just a few easy steps.
This intuitive UI offers real-time updates on your migration status, making your migration journey faster, more efficient, and less error-prone. Initially, the Cloud Migration Assistant supports dashboards, folders, and core data sources, with plans to include alerting, app plugins, and panel plugins in future updates.
Ready to make the move? Explore our migration guide to learn more about the Cloud Migration Assistant today and begin your effortless transition to Grafana Cloud.
Navigation bookmarks
Available in public preview in all editions of Grafana
As Grafana keeps growing, we have had feedback that it can be hard to find the pages you are looking for in the navigation. That is why we have added a new section to the navigation called ‘Bookmarks’, so you can easily access all of your favourite pages at the top of the navigation.
This feature is being rolled out across Grafana Cloud now. To use Bookmarks in self-managed Grafana, turn on the pinNavItems
feature toggle in Grafana v11.2 or newer.

Dashboards and visualizations
Transformation updates
Generally available in all editions of Grafana
We’ve made a number of exciting updates to transformations!
You can now use variables in some transformations
Template variables are now supported for the Limit, Sort by, Filter data by values, Grouping to matrix (a community contribution ⭐️), Heatmap, and Histogram transformations. This enables dynamic transformation configurations based on panel data and dashboard variables.
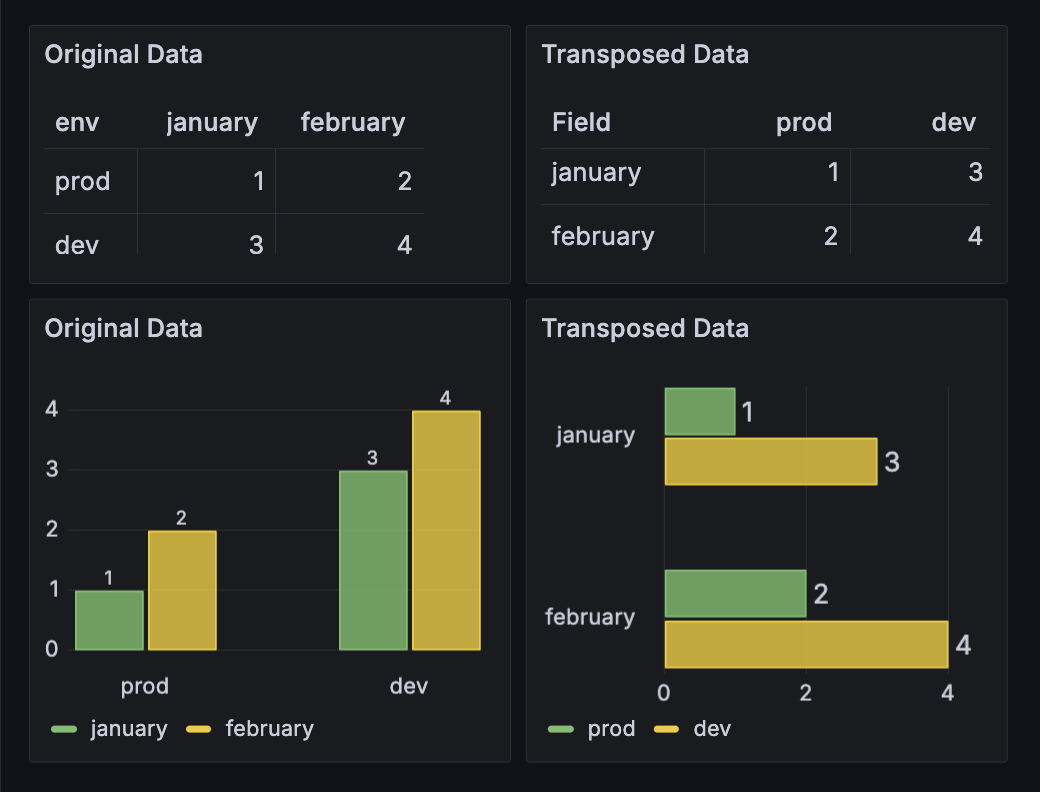
New transpose transformation
We’re excited to announce the new Transpose transformation, which allows you to pivot the data frame, converting rows into columns and columns into rows. This feature is particularly useful for data sources that don’t support pivot queries, enabling more flexible and insightful data visualizations.
For more information, refer to the documentation.
This feature is a community contribution ❤️
Group to nested tables is now generally available
We’re excited to announce that the Group to nested tables transformation is now generally available! Easily group your table data by specified fields and perform calculations on each group. With this transformation, you can enhance the depth and utility of your table visualizations.
See the documentation for more information.
Format string is now generally available
The Format string transformation is now generally available! Use this transformation to customize the output of a string field. From formatting your string data to upper, lower, title case, and more, this transformation provides a convenient way to standardize and tailor the presentation of string data for better visualization and analysis. See the documentation for more information.
New cumulative and window calculations available in Add field from calculation
The Add field from calculation transformation now supports both cumulative and window calculations. The cumulative function calculates on the current row and all preceding rows. You can calculate the total or the mean of your data up to and including the current row. With the window function you can calculate the mean, standard deviation, or variance on a specified set (window) of your data. The window can either be trailing or centered. With a trailing window the current row will be the last row in the window. With a centered window the window will be centered on the current row.
See the documentation for more information.
Improvements in canvas visualizations
Generally available in all editions of Grafana
Standardized tooltips
As a continuation of our efforts to standardize tooltips across visualizations, we’ve updated canvas visualization tooltips to be supported for all elements tied to data. Besides the element name and data, the tooltip now also displays the timestamp. This is a step forward from the previous implementation where tooltips were shown only if data links were configured.
Data links improvements
We’ve updated canvas visualizations so that you can add data links to canvas elements without using an override. The Selected element configuration now includes a Data links section where you can add data links to elements using the same steps as in other visualizations.
Data links in canvas elements can also be configured to open with a single click. To enable this functionality, select Link under the one One-click section in the Selected element data link options. If there are multiple data links for an element, the first link in the list has the one-click functionality.
As part of this improvement, we’ve also added the ability to control the order in which data links are displayed by dragging and dropping them. This improvement has been added to all visualizations.
In future releases, we’ll add one-click functionality to data links in other Grafana visualizations.
State timeline supports pagination
Generally available in all editions of Grafana
The state timeline visualization now supports pagination. The Page size option lets you paginate the state timeline visualization to limit how many series are visible at once. This is useful when you have many series. Previously, all the series in a state timeline were made to fit within the single window of the panel, which could make it hard to read.
With paginated results, the visualization displays a subset of all series on each page.
Pagination is especially useful if you’re running a query on a dynamic data source. It’s also helpful regardless of whether you have many data frames with just two fields (time + value) or few frames with many fields (time + many values).
This feature is a community contribution ❤️
Alerting
Centralized alert history page
Generally available in all editions of Grafana
View a history of all alert events generated by your Grafana-managed alert rules from one centralized page. This helps you see patterns in your alerts over time, observe trends, make predictions, and even debug alerts that might be firing too often.
An alert event is displayed each time an alert instance changes its state over a period of time. All alert events are displayed regardless of whether silences or mute timings are set, so you’ll see a complete set of your data history even if you’re not necessarily being notified.
For Grafana Enterprise and OSS users:
To try out the new alert history page, enable the alertingCentralAlertHistory feature toggle and
configure Loki annotations.
Explore
Logs filtering and pinning in Explore content outline
Generally available in all editions of Grafana
Grafana Explore now allows for logs filtering and pinning in content outline.
Filtering Logs: All log levels are now automatically available in the content outline. You can filter by log level, currently supported for Elasticsearch and Loki data sources. To select multiple filters, hold down the command key on Mac or the control key on Windows while clicking.
Pinning Logs: The new pinning feature allows users to pin logs to the content outline, making them easily accessible for quick reference during investigations. To pin a log, hover over a log in the logs panel and click on the Pin to content outline icon in the log row menu. Clicking on a pinned log will open the log context modal, showing the log highlighted in context with other logs. From here, you can also open the log in split mode to preserve the time range in the left pane while having the time range specific to that log in the right pane.
Forward direction search for Loki
Generally available in all editions of Grafana
Explore now supports forward direction search for Loki logs searches. This allows users to seamlessly browse logs in a time range in forward chronological order (for example, tracing a specific user’s actions using logs).
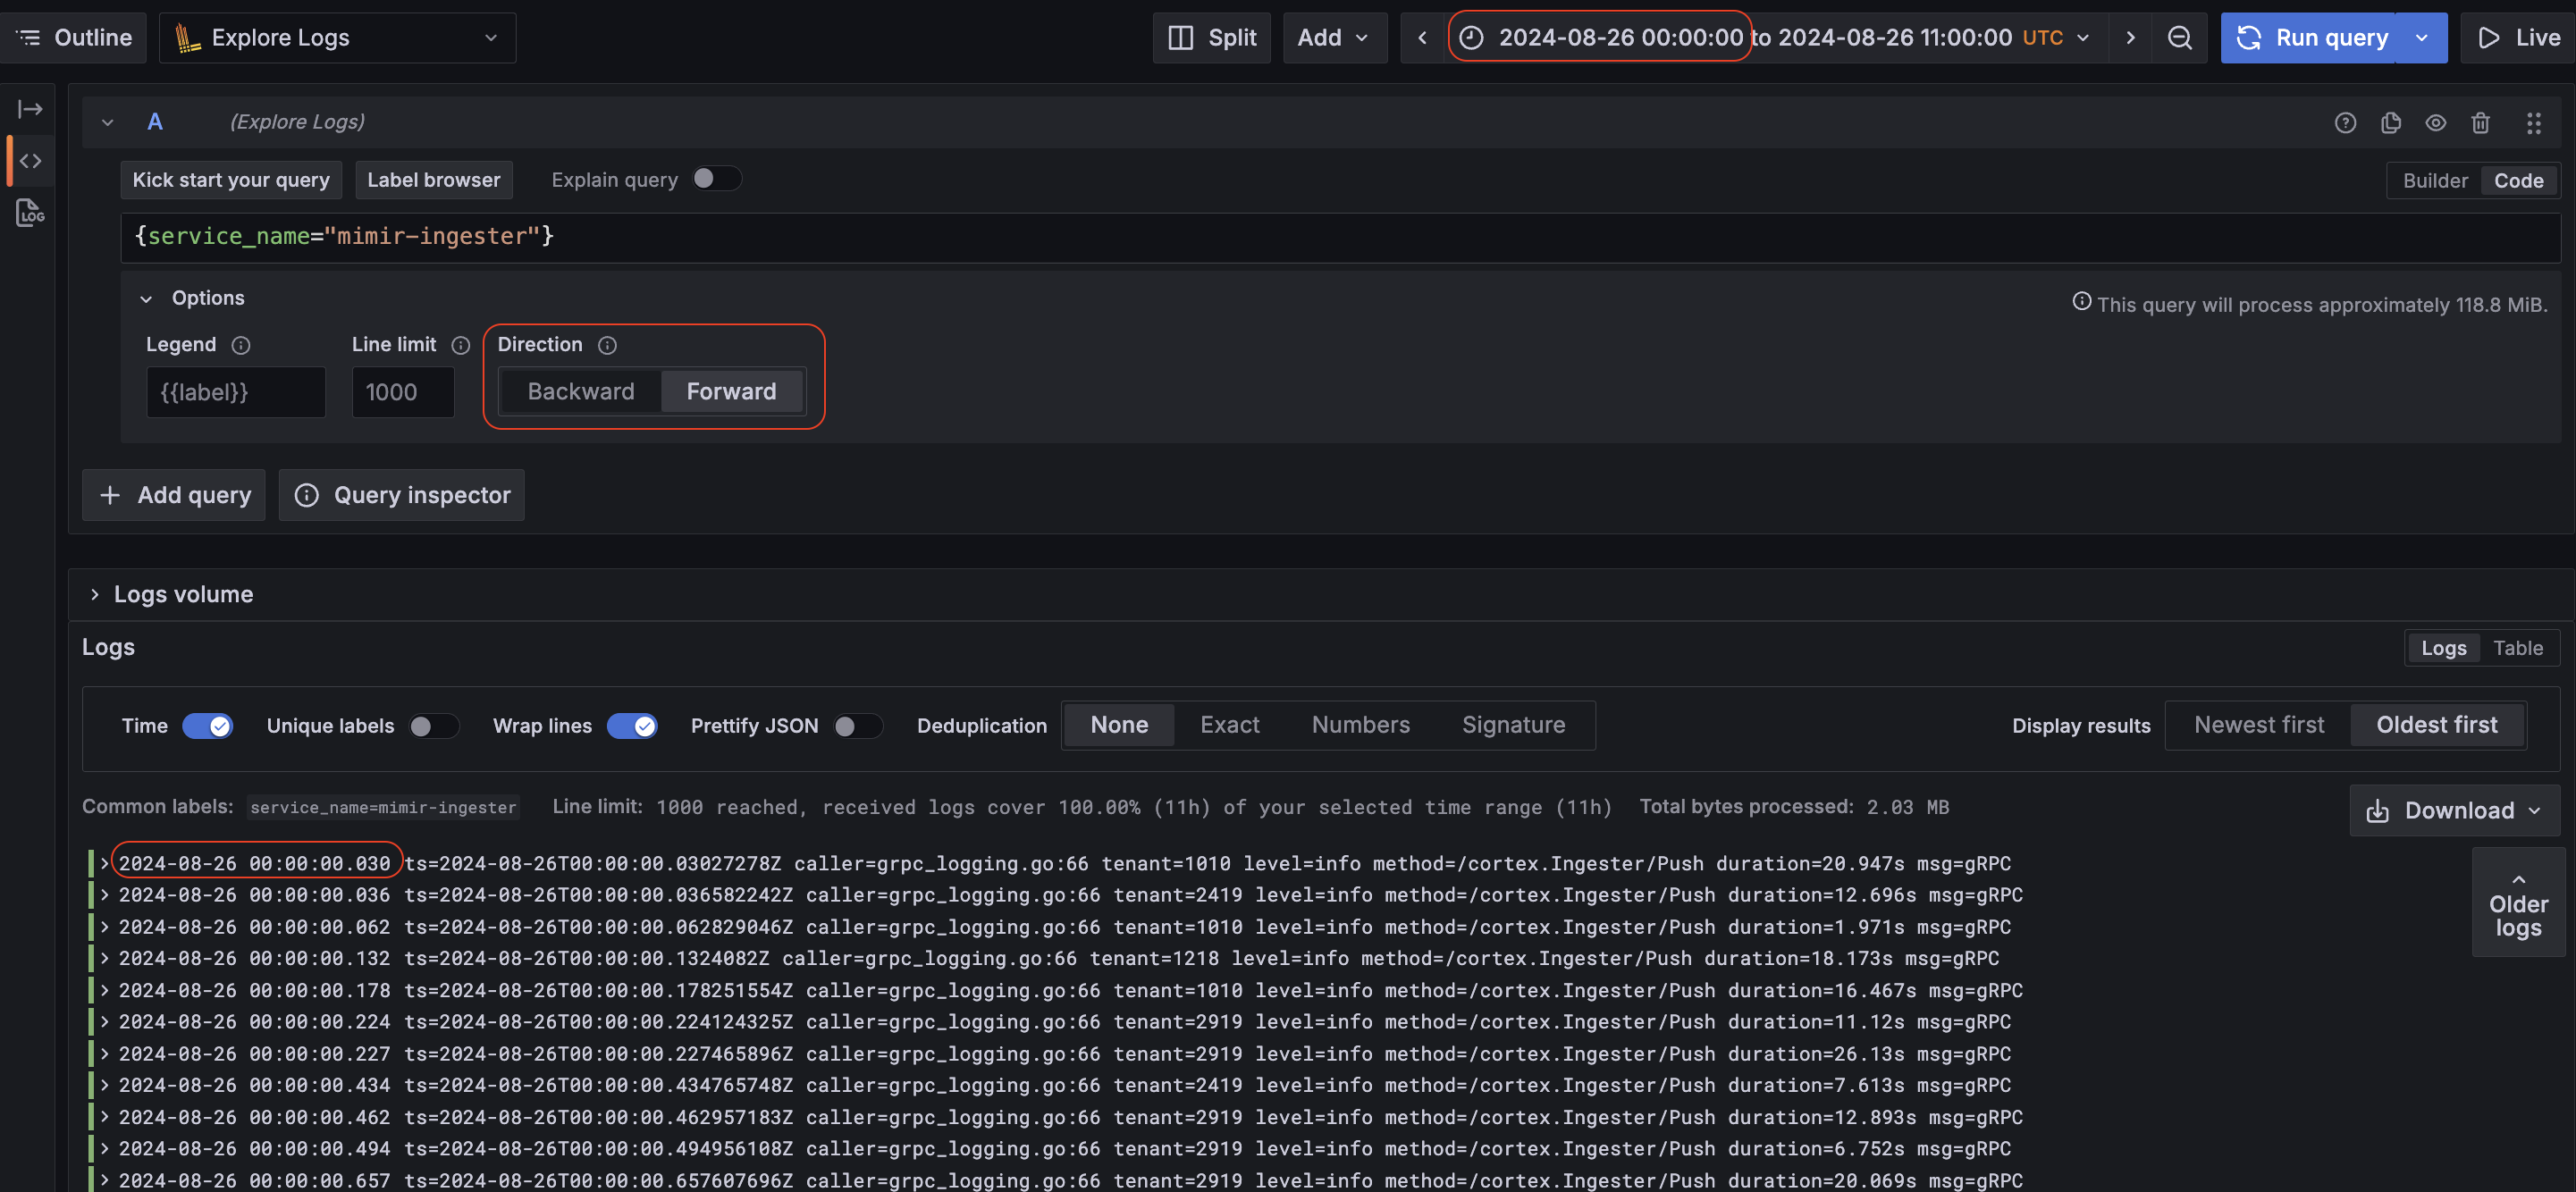
To use this feature, select Forward for the Direction option. Note that in the screenshot above, logs are rendered beginning from the starting time period of the query, not the end.
Data sources
Cloudwatch Metric Insights cross account observability support
Generally available in all editions of Grafana
We are excited to announce support for cross-account querying in Metric Insights query builder for AWS Cloudwatch Plugin. This enables building SQL queries to monitor across multiple accounts in the same region in AWS Cloudwatch.
This feature introduces an account drop-down for selecting one or all of your source accounts and builds a query that targets them. Furthermore, results can be grouped by account ID by selecting Account ID in the Group By drop-down.
For more complex queries that are not covered by the options in the builder you can switch to the manual Code editor and edit the query.
To set up cross-account querying for AWS Cloudwatch Plugin, see instructions here.
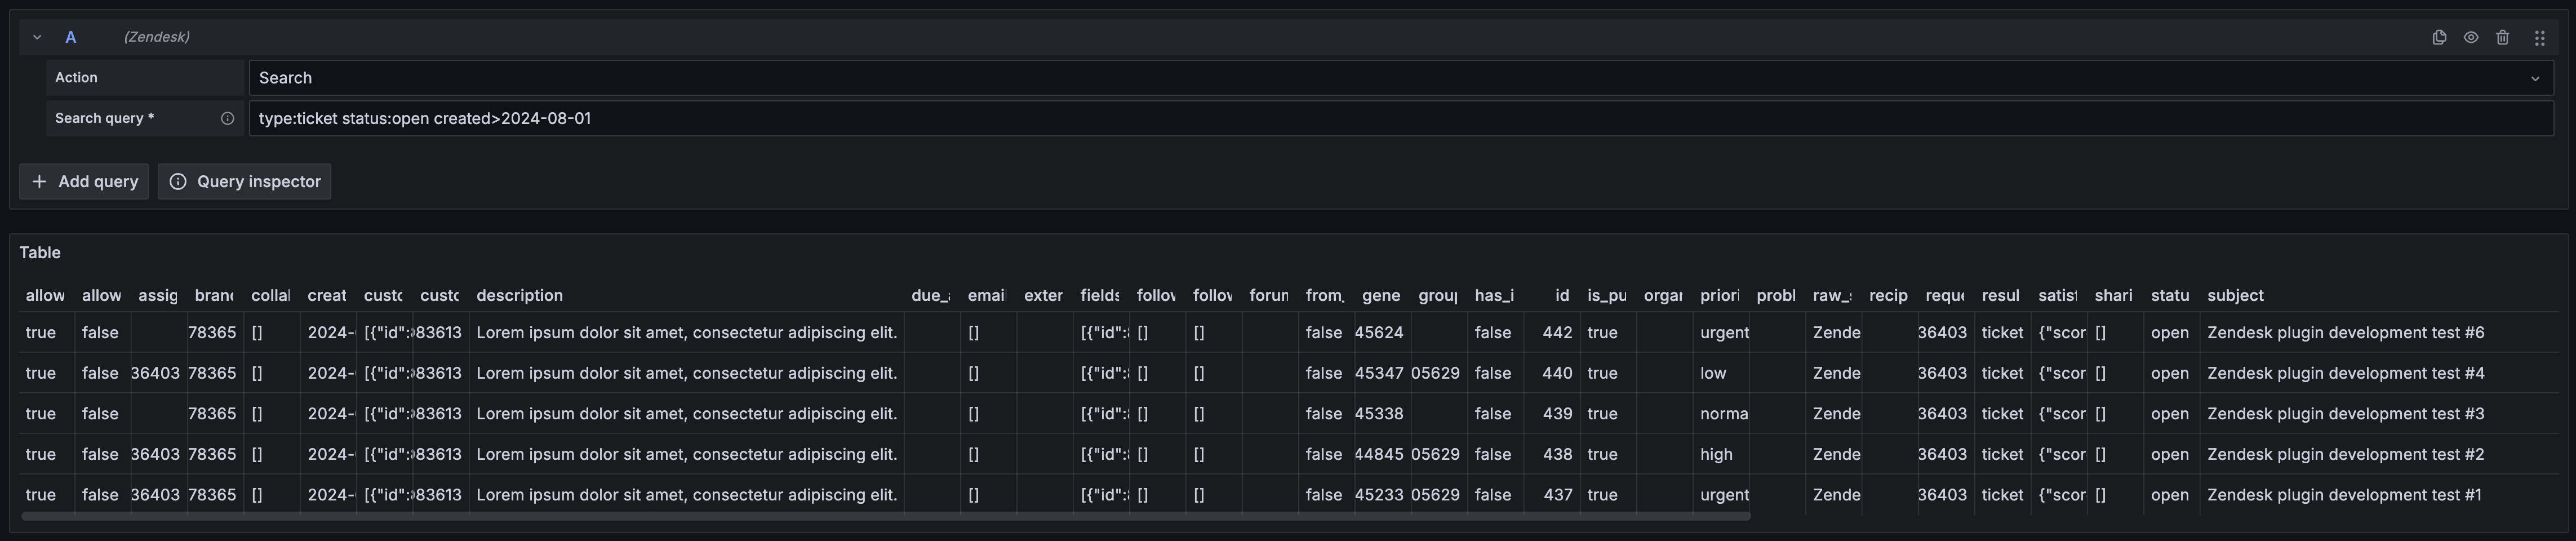
Zendesk data source for Grafana
Available in public preview in Grafana Enterprise and Grafana Cloud
We are excited to announce the release of a new Zendesk data source for Grafana. This addition extends Grafana’s capabilities, enabling seamless integration with Zendesk.
You can find out more about the data source in the Zendesk data source documentation.
Catchpoint Enterprise data source for Grafana
Available in public preview in Grafana Enterprise and Grafana Cloud
Introducing Catchpoint data source plugin.
The Catchpoint data source plugin allows you to query and visualize Tests, RUM and SLO data from within Grafana.
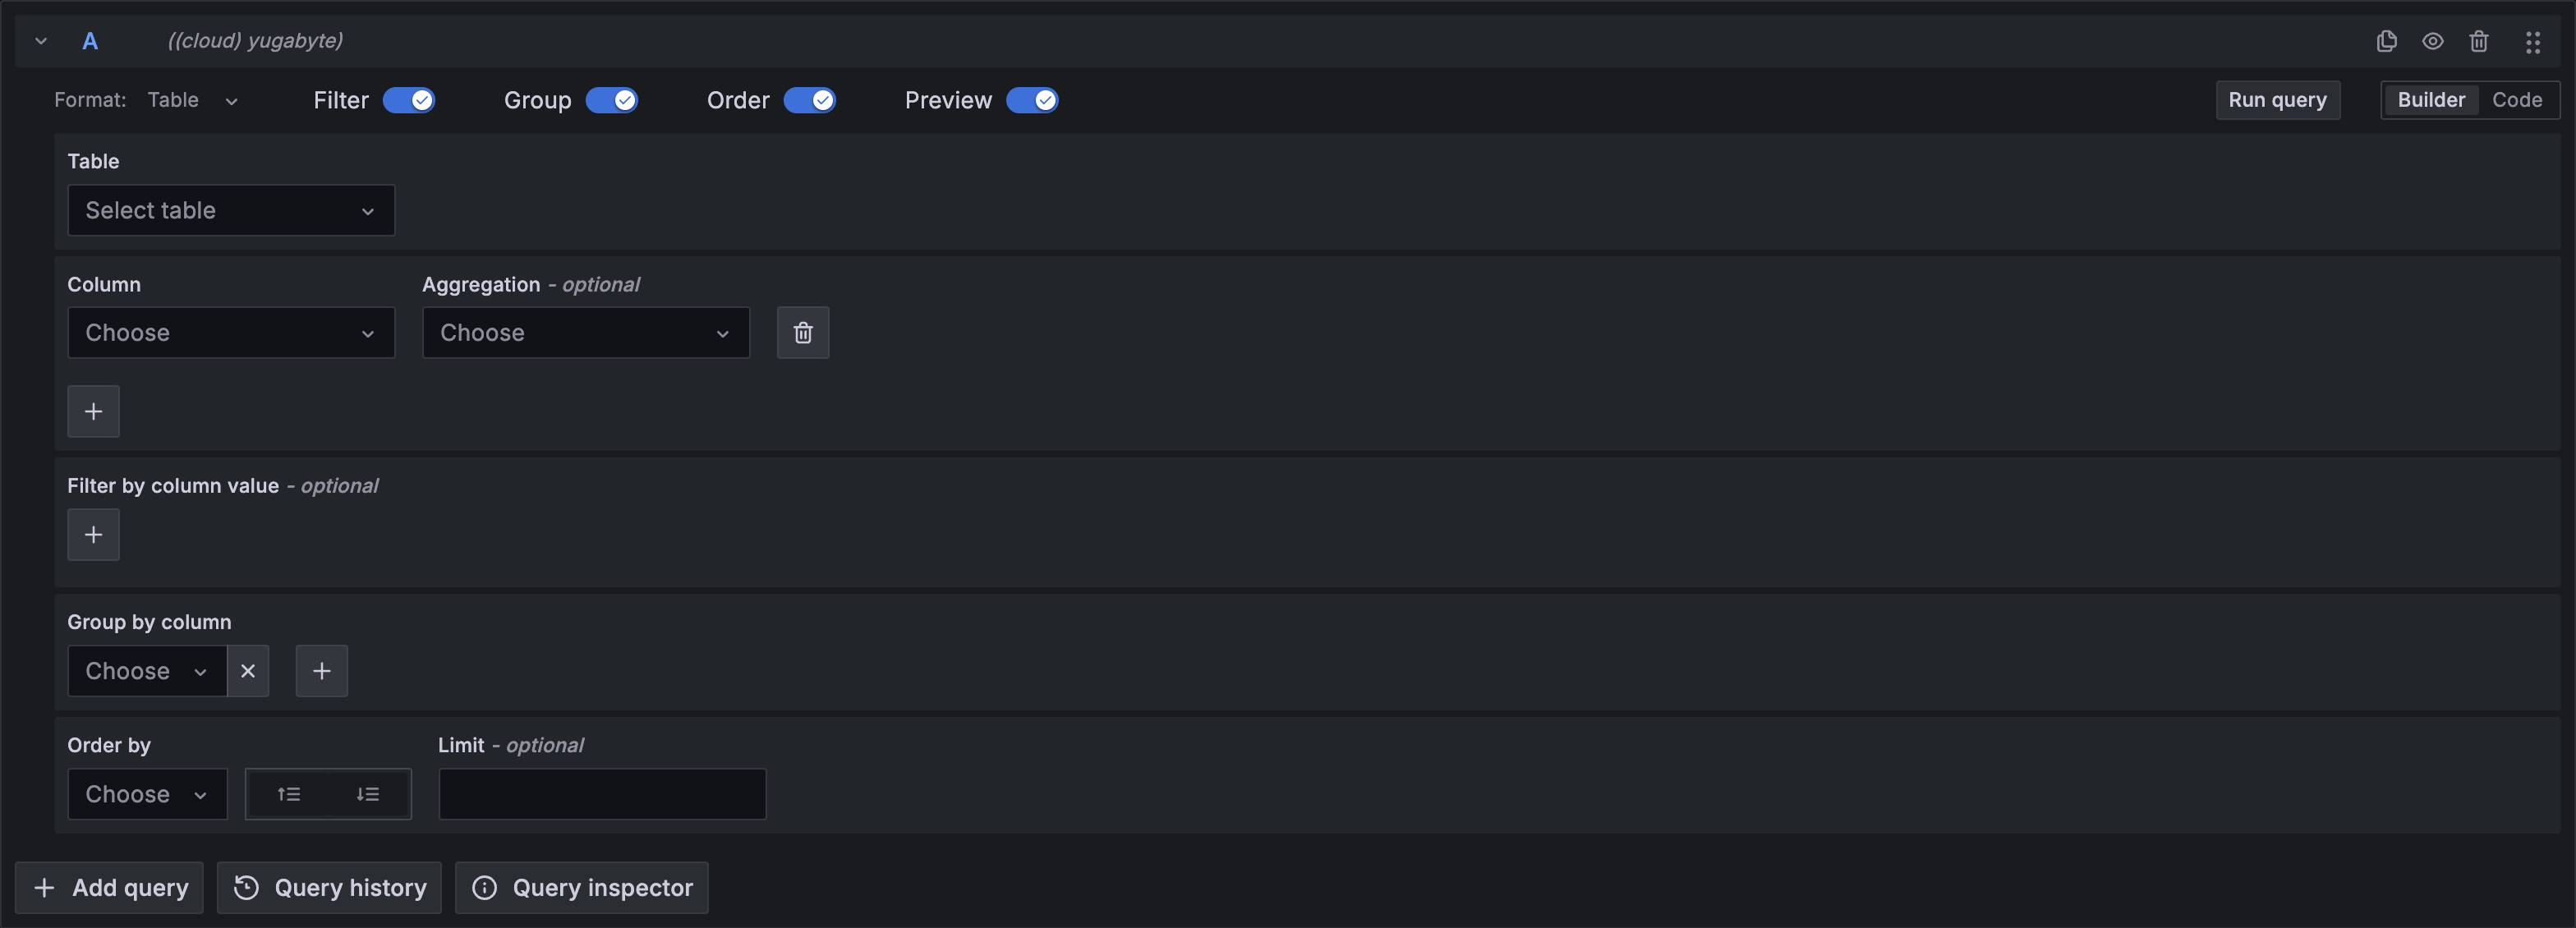
Yugabyte data source for Grafana
Available in public preview in all editions of Grafana
We are excited to announce the release of a new data source for Grafana: Yugabyte. This addition extends Grafana’s capabilities, enabling seamless integration with YugabyteDB.
You can find out more about the data source in the Yugabyte data source documentation.
The datasource has some known limitations: ad-hoc filters and TLS/network customization are not yet supported. Improvements and additional supported features are planned for future updates.
Authentication and authorization
Map org-specific user roles from your OAuth provider
Generally available in Grafana Open Source and Enterprise
Assign users to particular organizations with a specific role in Grafana, depending on an attribute value obtained from your identity provider.
This is a longstanding feature request from the community. We collaborated with our community to implement the request and have added this capability in Grafana 11.2.0.
For Generic OAuth and Okta, you can configure the claim (using the org_attribute_path setting) that contains the organizations which the user belongs to. Other OAuth providers use the same attribute for organization mapping that is used for group mapping: Entra ID (previously Azure AD), GitLab and Google use the current user’s Groups, and GitHub uses the user’s Teams.
To configure organization mapping for your instance, please check the documentation for the OAuth provider you are using in the Grafana documentation. You can find an example of how to configure organization mapping on each OAuth provider page under the Org roles mapping example section.
Better SAML integration for Azure AD
Generally available in all editions of Grafana
When setting up Grafana with Azure AD using the SAML protocol, the Azure AD Graph API sometimes returns a follow-up Graph API call rather than the information itself. This is the case for users who belong to more than 150 groups when using SAML.
With Grafana 11.2, we offer a mechanism for setting up an application as a Service Account in Azure AD and retrieving information from Graph API.
Please refer to our documentation on how to set up an Azure AD registered application for this setup.
API support for LDAP configuration
Available in public preview in all editions of Grafana
The SSO settings API has been updated to include support for LDAP settings. This feature is experimental behind the feature flag ssoSettingsLDAP.
You will soon be able to configure LDAP from the UI and Terraform.
Reduce number of required fields from the SAML form
Generally available in Grafana Enterprise and Grafana Cloud Pro and Advanced
The private key and certificate fields are no longer mandatory in the SAML form. To configure SAML without providing a private key and a certificate you have to opt out from using signed requests.
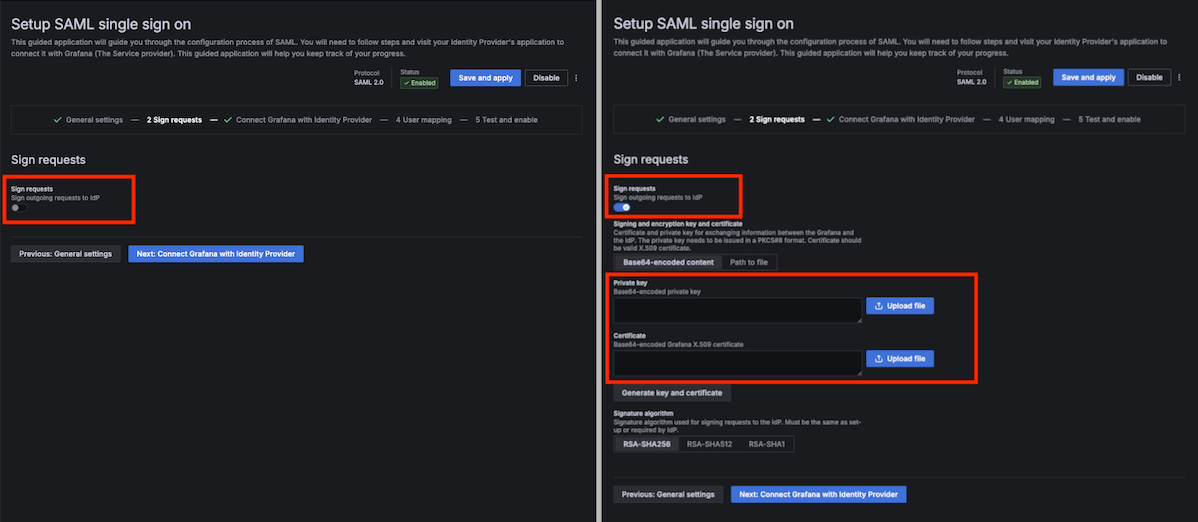
Generate SAML certificate and private key
Generally available in Grafana Enterprise and Grafana Cloud Pro
You can generate a new certificate and private key for SAML directly from the UI form. Click on the Generate key and certificate button from the Sign requests tab in the SAML form and then fill in the information you want to be embedded in your generated certificate.
OpenID Connect Discovery URL for Generic OAuth
Generally available in all editions of Grafana
The OpenID Connect Discovery URL is available in the Generic OAuth form. The info extracted from this URL will be used to populate the Auth URL, Token URL and API URL fields.


