Configure Alertmanagers
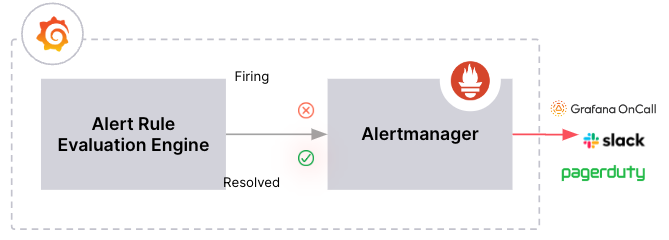
Grafana Alerting is based on the architecture of the Prometheus alerting system. Grafana sends firing and resolved alerts to an Alertmanager, which is responsible for handling notifications. This architecture decouples alert rule evaluation from notification handling, improving scalability.
Grafana includes a built-in Grafana Alertmanager to handle notifications. This guide shows you how to:
- Use different types of Alertmanagers with Grafana
- Add other Alertmanager and enable it to receive all Grafana-managed alerts
- Use an Alertmanager as a contact point to route specific alerts
Alertmanager resources
It’s important to note that each Alertmanager manages its own independent alerting resources, such as:
- Contact points and notification templates
- Notification policies and mute timings
- Silences
- Active notifications
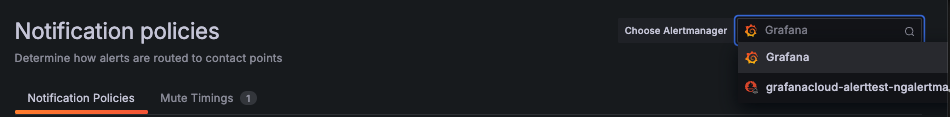
Use the Choose Alertmanager dropdown on these pages to switch between Alertmanagers and view or manage their resources.
Types of Alertmanagers in Grafana
Grafana can be configured to handle alert notifications using various Alertmanagers.
Grafana Alertmanager: Grafana includes a built-in Alertmanager that extends the Prometheus Alertmanager. This is the default Alertmanager and is referred to as “Grafana” in the user interface. It can only handle Grafana-managed alerts.
Cloud Alertmanager: Each Grafana Cloud instance comes preconfigured with an additional Alertmanager (
grafanacloud-STACK_NAME-ngalertmanager) from the Mimir (Prometheus) instance running in the Grafana Cloud Stack.The Cloud Alertmanager is available exclusively in Grafana Cloud and can handle both Grafana-managed and data source-managed alerts.
Other Alertmanagers: Grafana Alerting also supports sending alerts to other Alertmanagers, such as the Prometheus Alertmanager, which can handle both Grafana-managed and data source-managed alerts.
Grafana Alerting supports using a combination of Alertmanagers and can enable other Alertmanagers to receive Grafana-managed alerts. The decision often depends on your alerting setup and where your alerts are generated.
For example, if you already have an Alertmanager running in your on-premises or cloud infrastructure to handle Prometheus alerts, you can forward Grafana-managed alerts to the same Alertmanager for unified notification handling.
Add an Alertmanager
Alertmanagers should be configured as data sources using Grafana Configuration from the main Grafana navigation menu. To add an Alertmanager, complete the following steps.
Click Connections in the left-side menu.
Under Your connections, click Data sources.
Enter
Alertmanagerin the search bar.Click Alertmanager.
The Settings tab of the data source is displayed.
Set the data source’s basic configuration options:
For provisioning instructions, refer to the Alertmanager data source documentation.
After adding an Alertmanager, you can use the Grafana Alerting UI to manage notification policies, contact points, silences, and other alerting resources from within Grafana.
Note
When using Prometheus, you can manage silences in the Grafana Alerting UI. However, other Alertmanager resources such as contact points, notification policies, and templates are read-only because the Prometheus Alertmanager HTTP API does not support updates for these resources.
When using multiple Alertmanagers, use the Choose Alertmanager dropdown to switch between Alertmanagers.
Enable an Alertmanager to receive Grafana-managed alerts
After enabling Receive Grafana Alerts in the Data Source Settings, you must also configure the Alertmanager in the Alerting Settings page. Grafana supports enabling one or multiple Alertmanagers to receive all generated Grafana-managed alerts.
- In the left-side menu, click Alerts & IRM and then Alerting.
- Click Settings to view the list of configured Alertmanagers.
- For the selected Alertmanager, click the Enable/Disable button to toggle receiving Grafana-managed alerts. When activated, the Alertmanager displays
Receiving Grafana-managed alerts.
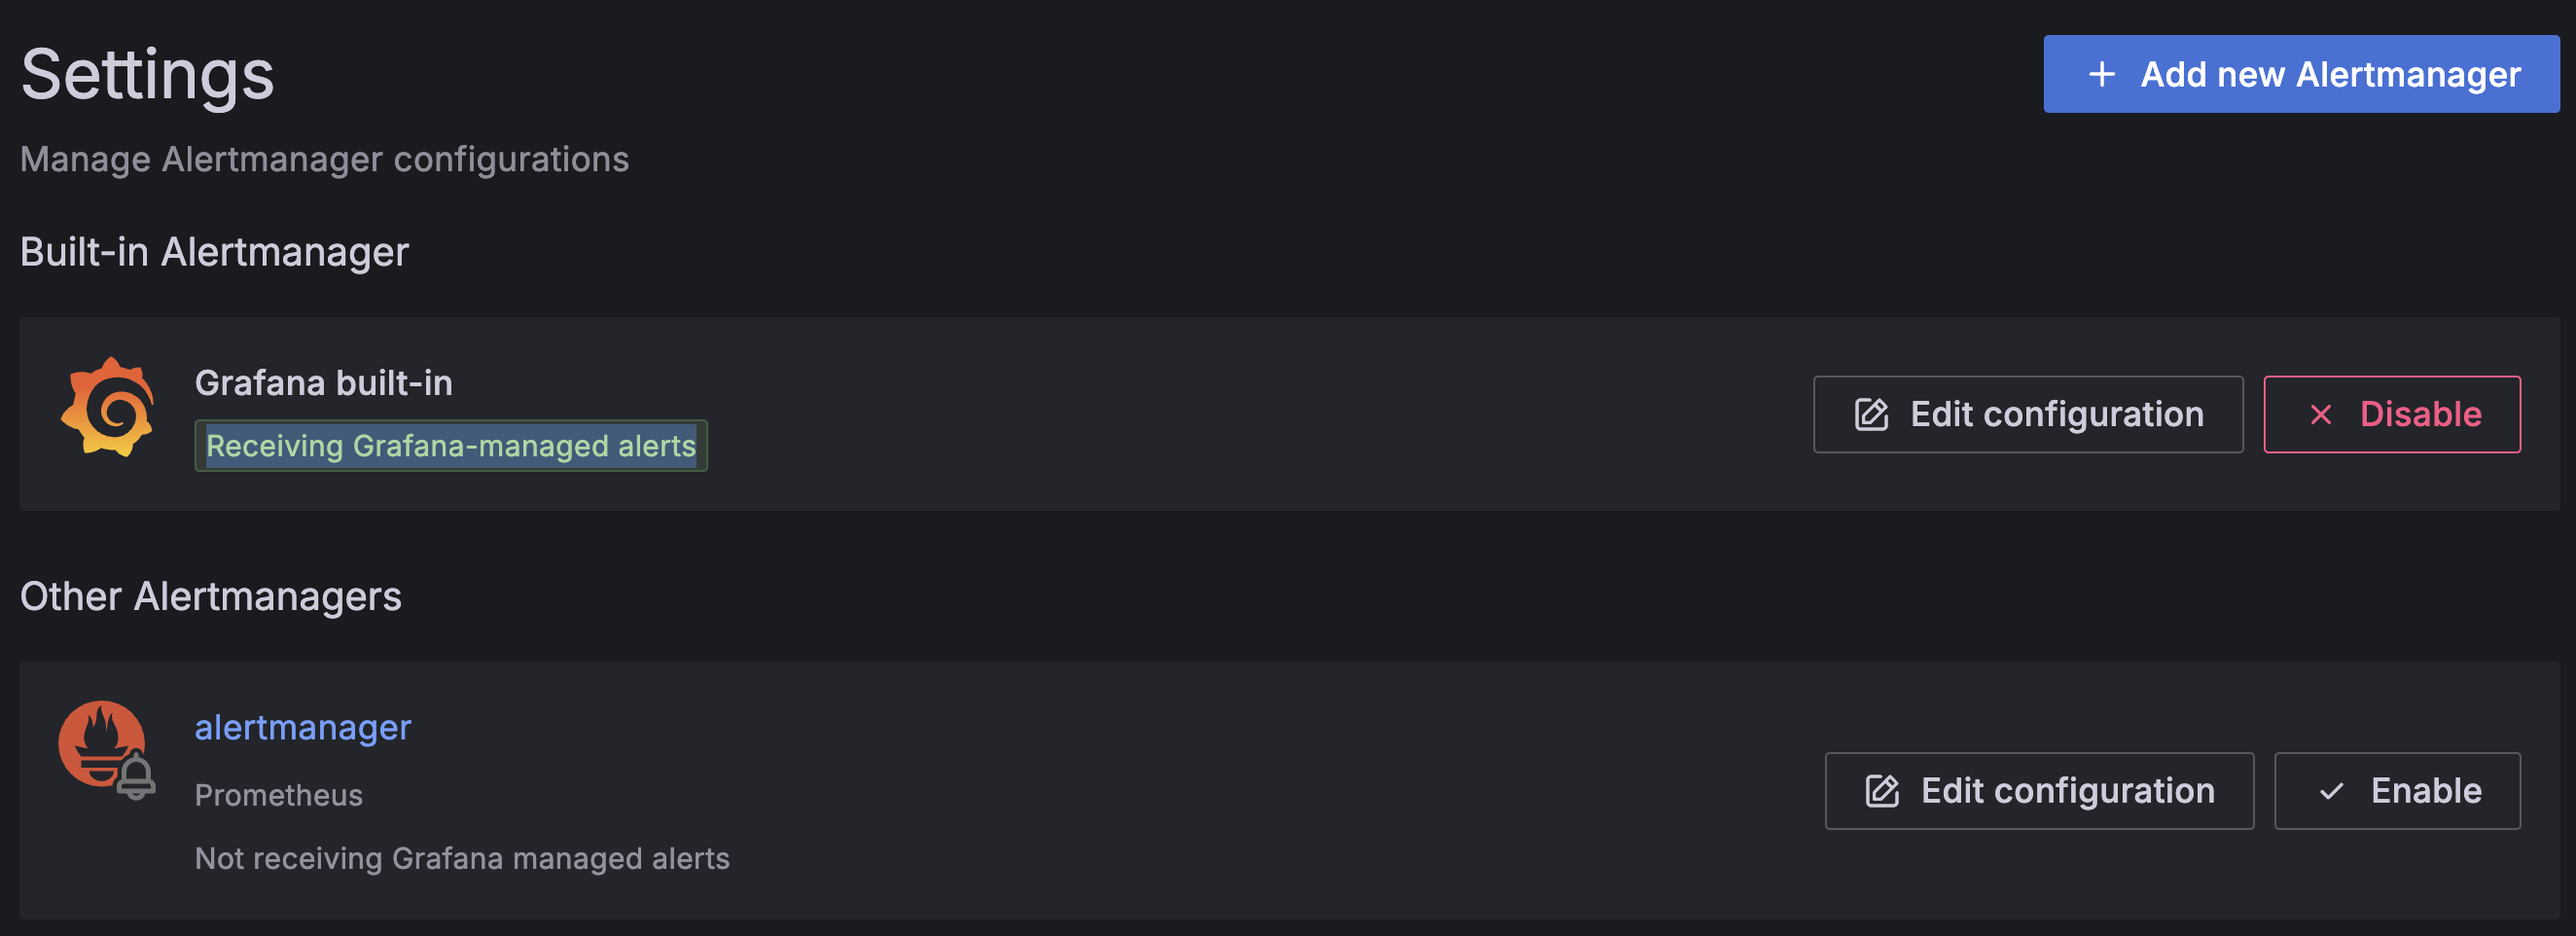
All Grafana-managed alerts are forwarded to Alertmanagers marked as Receiving Grafana-managed alerts.
Note
Grafana Alerting does not support forwarding Grafana-managed alerts to the AlertManager in Amazon Managed Service for Prometheus. For more details, refer to this GitHub issue.
Use an Alertmanager as a contact point to receive specific alerts
The previous instructions enable sending all Grafana-managed alerts to an Alertmanager.
To send specific alerts to an Alertmanager, configure the Alertmanager as a contact point. You can then assign this contact point to notification policies or individual alert rules.
For detailed instructions, refer to:
Manage Alertmanager configurations
On the Settings page, you can also manage your Alertmanager configurations.
- Manage version snapshots for the built-in Alertmanager, which allows administrators to roll back unintentional changes or mistakes in the Alertmanager configuration.
- Compare the historical snapshot with the latest configuration to see which changes were made.


