
Example of alerting on tabular data
Not all data sources return time series data. SQL databases, CSV files, and some APIs often return results as rows or arrays of columns or fields — commonly referred to as tabular data.
This example shows how to create an alert rule using data in table format. Grafana treats each row as a separate alert instance, as long as the data meets the expected format.
How Grafana Alerting evaluates tabular data
When a query returns data in table format, Grafana transforms each row into a separate alert instance.
To evaluate each row (alert instance), it expects:
- Only one numeric column. This is the value used for evaluating the alert condition.
- Non-numeric columns. These columns defines the label set. The column name becomes a label name; and the cell value becomes the label value.
- Unique label sets per row. Each row must be uniquely identifiable by its labels. This ensures each row represents a distinct alert instance.
Caution
These three conditions must be met—otherwise, Grafana can’t evaluate the table data and the rule will fail.
Example overview
Imagine you store disk usage in a DiskSpace table and you want to trigger alerts when the available space drops below 5%.
To calculate the free space per Host and Disk in this case, you can use $__timeFilter to filter by time but without returning the date to Grafana:
SELECT
  Host,
  Disk,
  AVG(PercentFree) AS PercentFree
FROM DiskSpace
WHERE $__timeFilter(Time)
GROUP BY Host, Disk
This query returns the following table response:
When Alerting evaluates the query response, the data is transformed into three alert instances as previously detailed:
- The numeric column becomes the value for the alert condition.
- Additional columns define the label set for each alert instance.
Finally, an alert condition that checks for less than 5% of free space ($A < 5) would result in two alert instances firing:
Try it with TestData
To test this quickly, you can simulate the table using the TestData data source:
Add the TestData data source through the Connections menu.
Go to Alerting and create an alert rule
Select TestData as the data source.
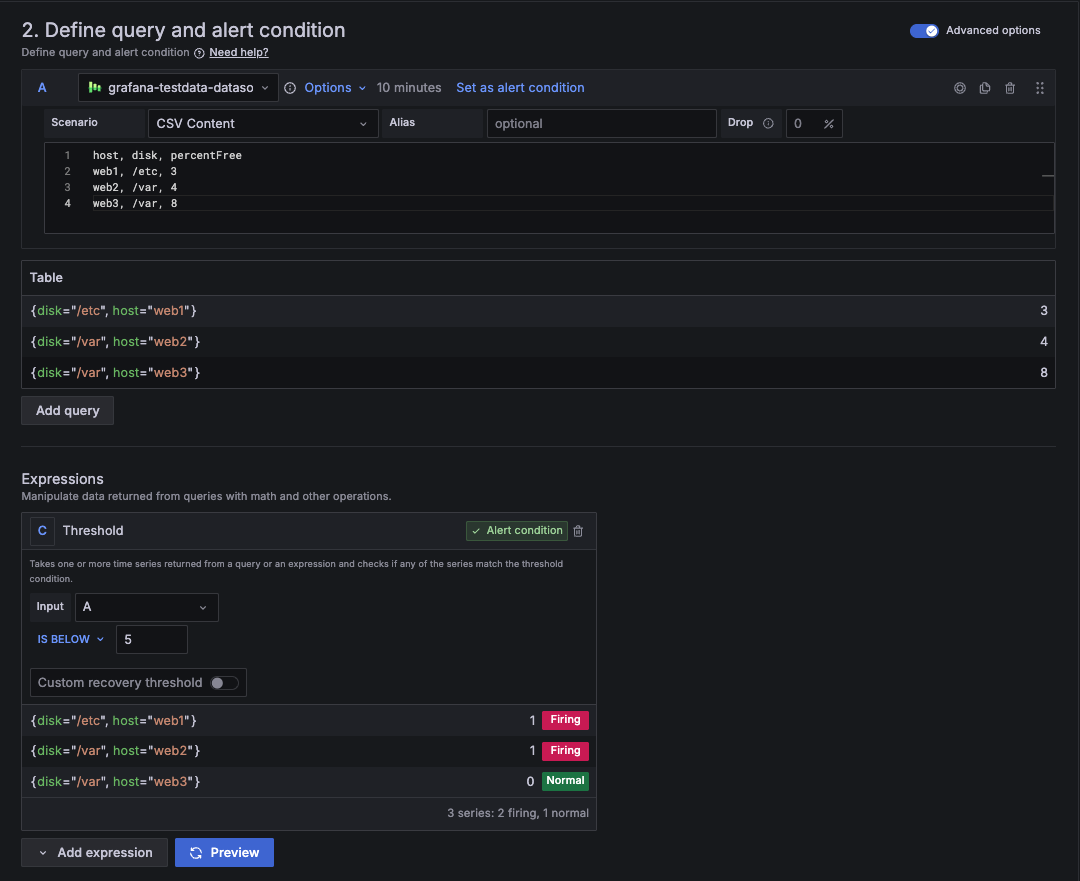
From Scenario, select CSV Content and paste this CSV:
host, disk, percentFree
web1, /etc, 3
web2, /var, 4
web3, /var, 8
Set a condition like
$A < 5and Preview the alert.Grafana evaluates the table data and fires the two first alert instances.
![Alert preview with tabular data using the TestData data source]()
Differences with time series data
Working with time series is similar—each series is treated as a separate alert instance, based on its label set.
The key difference is the data format:
- Time series data contains multiple values over time, each with its own timestamp.
To evaluate the alert condition, alert rules must reduce each series to a single number using a function like
last(),avg(), ormax(). - Tabular data doesn’t require reduction, as each row contains only a single numeric value used to evaluate the alert condition.
For comparison, see the multi-dimensional time series data example.
Was this page helpful?
Related resources from Grafana Labs


