What’s new in Grafana v11.3
Welcome to Grafana 11.3! Scenes-powered dashboards are now generally available and the Explore Logs plugin is now installed by default. The dashboard experience has also improved in other ways including the ability to trigger API calls from any canvas element with the new Actions option and an update to transformations so you can apply calculations to dynamic fields. We’ve also simplified the alert setup experience, added customizable announcement banners that admins can send to all users, and improved some default permissions.
For even more detail about all the changes in this release, refer to the changelog. For the specific steps we recommend when you upgrade to v11.3, check out our Upgrade Guide.
Scenes-powered Dashboards are generally available
Generally available in all editions of Grafana
For the past few months we’ve been working on a major update of our Dashboards architecture and migrated it to the Scenes library. This migration provides us with more stable, dynamic, and flexible dashboards as well as setting the foundation for what we envision the future of Grafana dashboards will be. Here are four of the improvements that are being introduced as part of this work:
View mode and Edit mode
It can be difficult to efficiently navigate through the visually cluttered options during the dashboard editing process. When in View mode, the dashboard screen is less clutteed. In Edit mode, options like adding a panel and changing settings are easier to access.
Template variables and the time range picker remain visible as your scroll
The time picker is now the dashboard canvas rather than the toolbar, and now, together with template variables, it will stick to the top as you scroll through your dashboard. This is a highly requested feature that we’re very happy to be able to roll out!
Timezone parameter in Grafana URL
We’ve added a new time zone URL parameter, tz. This allows sharing dashboards with a selected time zone, ensuring that the receiver views it in the intended time zone regardless of their local settings.
Kiosk mode displays dashboard controls
When playing a playlist or displaying a dashboard in full screen, you can see controls by default. These controls include the time range picker, refresh button, variables, annotations, and links.
If you prefer to hide these controls during playlist playback, new configuration options are available when starting a playlist. You can choose which controls to display while the playlist is running.
For configuring controls outside of playlist playback, you can use the following URL parameters:
_dash.hideTimePicker: Hides the time and refresh picker_dash.hideVariables: Hides variables and annotations controls_dash.hideLinks: Hides dashboard links
Known limitations
The variable usage check is not yet available.
Editing a panel:
- The Library panels tab is not available anymore. You can replace a library panel from the panel menu.
- The Overrides tab is not in panel options (coming in Grafana v11.3.0). Overrides are shown at the bottom of the option list.
- The drop-down menu to collapse the visualization picker is missing (coming in Grafana v11.3.0).
The Share button is not visible when edit mode is enabled (coming in Grafana v11.3.0).
If you want to learn more, in detail, about all the improvements we’ve made, don’t miss our blog post.
Additional dashboard and visualization improvements
Auto-formatted table cell values in Cell Inspect
Generally available in all editions of Grafana
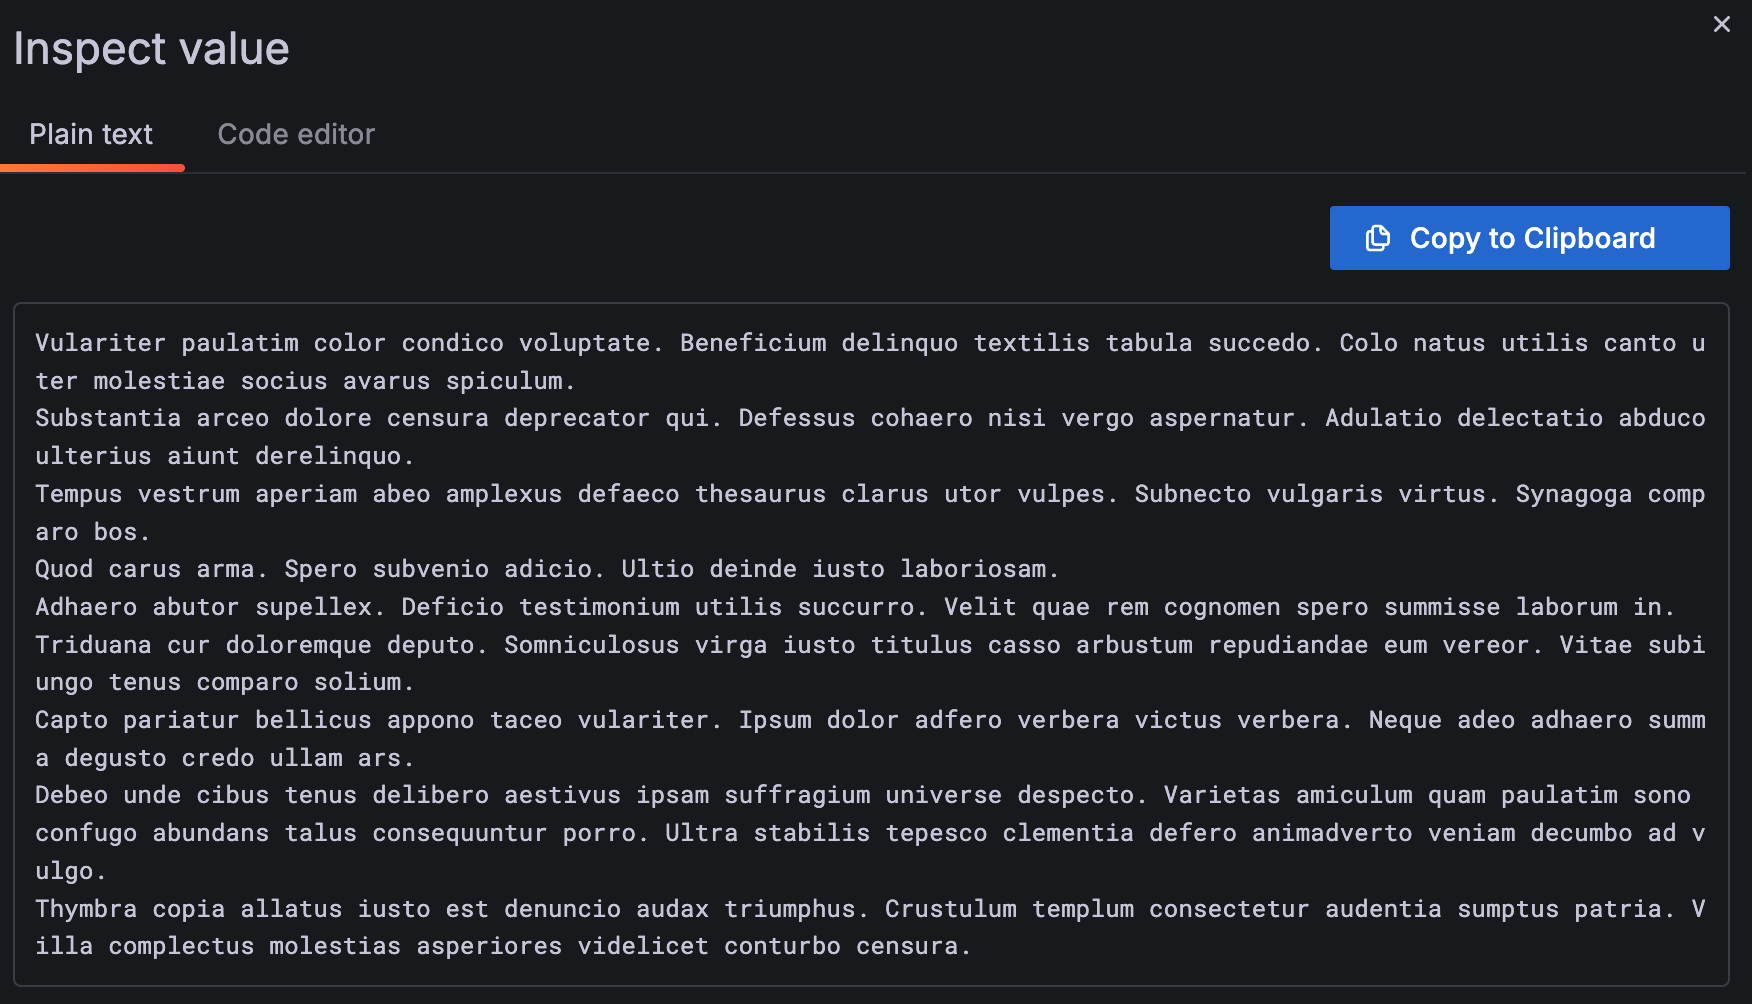
We’ve improved the inspect value experience in table visualizations with the addition of tabs in the Inspect value drawer: Plain text and Code editor.
When the Cell inspect value switch is toggled on, clicking the inspect icon in a cell opens the drawer. Grafana attempts to automatically detect the type of data in the cell and opens the drawer with the associated tab showing. However, you can switch back and forth between tabs.
Canvas actions
Experimental in all editions of Grafana
We’ve updated canvas visualizations so that now you can add actions to canvas elements, like opening an issue in GitHub or calling any API. The Selected element configuration now includes a Data links and actions section where you can add actions to elements. Each action can be configured to call an API endpoint.
Actions can also be configured to be triggered with a single click. To enable this functionality, select Action under the one One-click section in the Selected element data links and actions option. If there are multiple actions for an element, the first action in the list has the one-click functionality.
Also, we’ve also added the ability to control the order in which actions are displayed in the tooltip by dragging and dropping them.
To try out this feature, enable the vizActions feature toggle.
Legend support in bar gauge visualizations
Generally available in all editions of Grafana
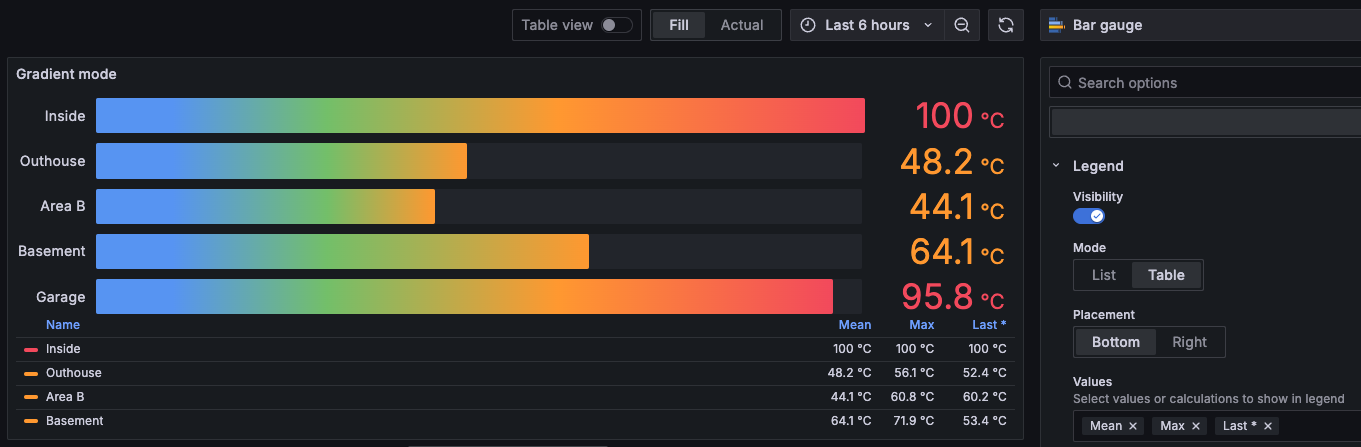
We’ve added legend support to bar gauge visualizations. This is part an effort to standardize legends and make them available across more panels. You can customize legends by navigating to the Legend section in panel options. By default, the legend is disabled.
You can also hide names in each bar gauge, since they are redundant to the legend. To do that, in the Name placement option, choose Hidden.
Apply the same binary transformation to all the number fields in a given table at once
Generally available in all editions of Grafana
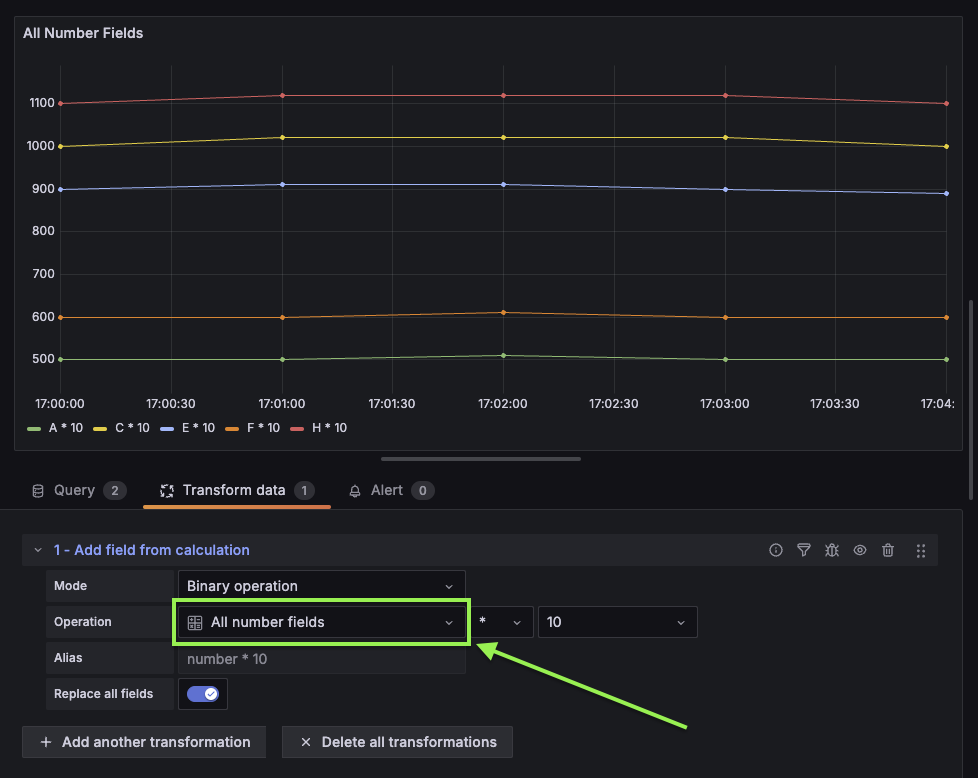
When you set up a binary operation using the Add field from calculation transformation (for example, dividing each column by a certain value), there’s a new All number fields option available to select. Use this to apply a mathematical operator to multiple number fields simultaneously. This feature is particularly useful when you’re scaling or offsetting data containing multiple, dynamically-named fields, allowing the transformation to be applied when dealing with unknown field names.
Actions for visualizations
Experimental in all editions of Grafana
We’ve updated several visualizations so that now you can add actions to them. The panel configuration now includes a Data links and actions section where you can add actions that can each be configured to call an API endpoint.
Also, we’ve also added the ability to control the order in which actions are displayed in the tooltip by dragging and dropping them.
This functionality has been added for the following visualizations:
- Bar chart
- Candlestick
- Heatmap
- State timeline
- Status history
- Time series
- Trend
- XY chart
To try out this feature, enable the vizActions feature toggle.
Explore Logs
The Explore Logs plugin is installed by default
Generally available in all editions of Grafana
With Explore Logs you can visualize and explore your logs to troubleshoot without having to write queries. It is easy to find spikes in your log volume, filter your logs and pinpoint problematic log lines.
While Explore Logs is GA in cloud and installed there by default already, with Grafana v11.3.0 it will be automatically installed on your Open Source or Enterprise instance as well. This will let you use Explore Logs alongside Explore Metrics without needing to install it manually.
This is configured by the preinstall configuration parameter in your Grafana configuration. For more information about Explore logs, refer to
the documentation.
Correlations
Add correlations to external URLs in Explore
Generally available in all editions of Grafana
Correlations is a feature that allows Grafana users to set up links between their data sources. Previously, the link generated would only be from one query to another—meaning results from a query could only generate links to open a second Explore pane with other query results.
With this feature, users can now link to third party web-based software based on their search results. The format follows the standard Grafana format for using variables.
Alerting
Simplified query section for alert rule creation
Generally available in all editions of Grafana
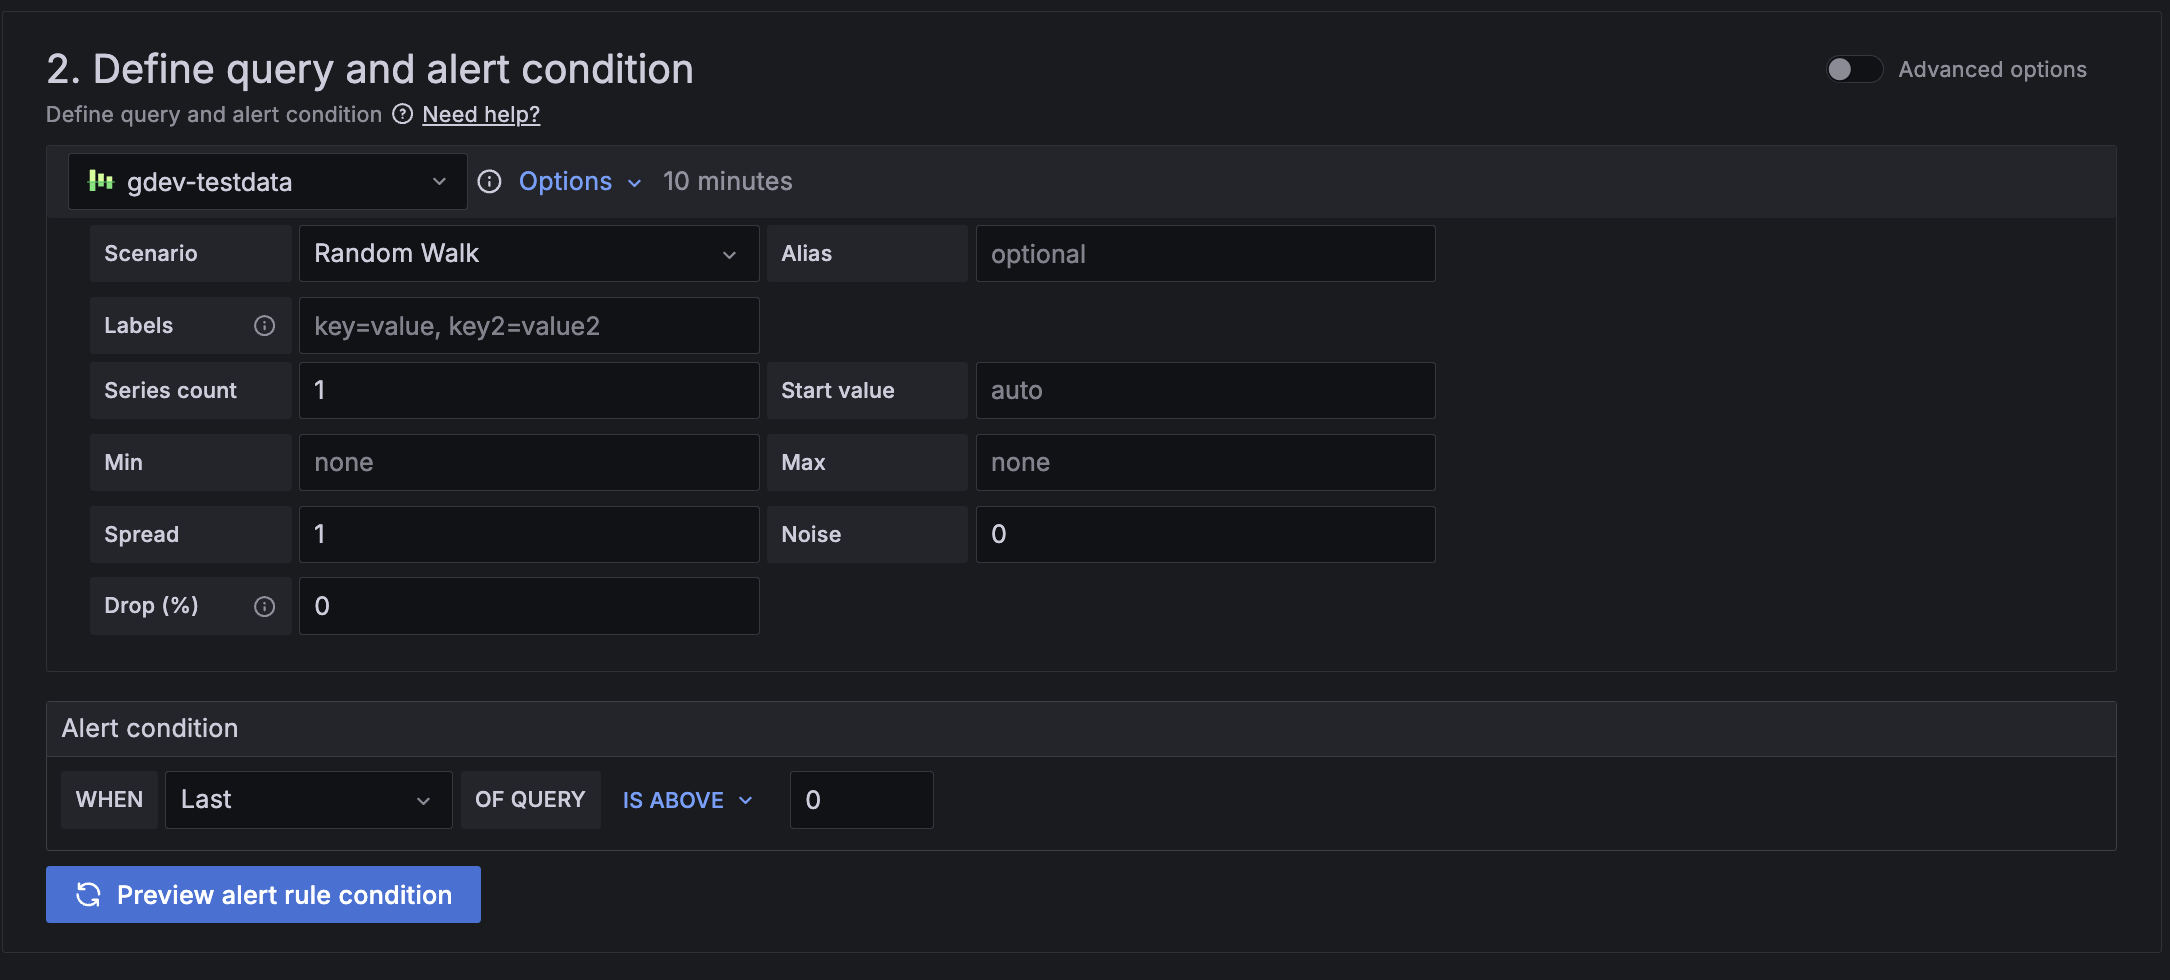
Use a simplified version of the query and alert conditions step to create Grafana-managed alert rules. The default options streamline rule creation with a cleaner header and a single query and condition. For more complex rules, switch to advanced options to add multiple queries and expressions.
This feature is rolling out to Grafana Cloud over the next couple of weeks.
Grafana Enterprise and OSS:
To use this feature, enable the alertingQueryAndExpressionsStepMode feature toggle.
Role-based access control for notifications in Alerting
Available in public preview in Grafana Enterprise and Grafana Cloud
Manage contact points, mute timings, and notification templates through Role-Based Access Control (RBAC). Choose who can create, edit, and read contact points, mute timings, and notification templates using permissions or fixed roles.
For mute timings and notification templates, you can grant all users all permissions or no permissions. For contact points, you can extend or limit permissions to individual contact points.
Recording rules for Grafana-managed alerts
Generally available in all editions of Grafana
Create recording rules for Grafana-managed alert rules to calculate frequently needed expressions or computationally expensive expressions in advance and save the result as a new set of time series. Querying this new time series is faster, especially for dashboards since they query the same expression every time the dashboards refresh. Previously, this was only available for data-source managed alert rules.
In Grafana OSS and Enterprise, you can create both Grafana-managed and data source-managed recording rules if you enable the grafanaManagedRecordingRules feature flag.
Data sources
GitHub App authentication for the GitHub data source
Generally available in all editions of Grafana
Authenticate the GitHub data source using a GitHub App, an alternative to personal access tokens (PATs). GitHub App authentication offers enhanced security by granting more granular permissions, reducing the risk of over-permissioning.
For more information, refer to the GitHub data source documentation for detailed instructions on setting up GitHub App authentication.
Announcement banner
Available in public preview in Grafana Enterprise and Grafana Cloud
Grafana admins struggle to effectively communicate important updates and maintenance information to their users through traditional channels like email and Slack. Now you can display customizable banners within the Grafana interface to ensure critical information is visible and timely. This ensures that all users are immediately informed of important updates, maintenance schedules, compliance info, or other crucial messages, reducing the likelihood of missed communications and enhancing overall user awareness and engagement.
By default, only organization administrators can create announcement banners. You can customize who can create announcement banners with Role-based access control.
To use the Announcement banner in self-managed Grafana, turn on the notificationBanner
feature toggle in Grafana v11.3 or newer and navigate in your Grafana instance to Admin > General > Announcement Banner

Improved subfolder creation flow
Generally available in all editions of Grafana
You can now create subfolders within folders where you have Edit or Admin rights without needing any additional permissions. This enables users and teams to fully manage their folder and dashboard hierarchy, and allows you to keep your instance secure by granting users the minimum necessary set of permissions.
Plugins
Plugin details page redesign
Available in public preview in all editions of Grafana
To help make it easier for administrators to assess and interact with Grafana plugins, we are reworking the plugin details page to highlight important metadata, such as when the plugin was last updated.
We intend to further extend this new layout with consistent links for all plugins, to complement the custom links which can currently be optionally configured. This improved consistency will enable simpler interaction with a plugin’s developer - whether that is Grafana Labs, our commercial partners, or our community. These links will include actions such as raising feature requests or bug reports, as well as allowing our community developers to indicate available support and sponsorship options for those that depend on their work.
Authentication and authorization
Configure LDAP through the UI
Available in public preview in all editions of Grafana
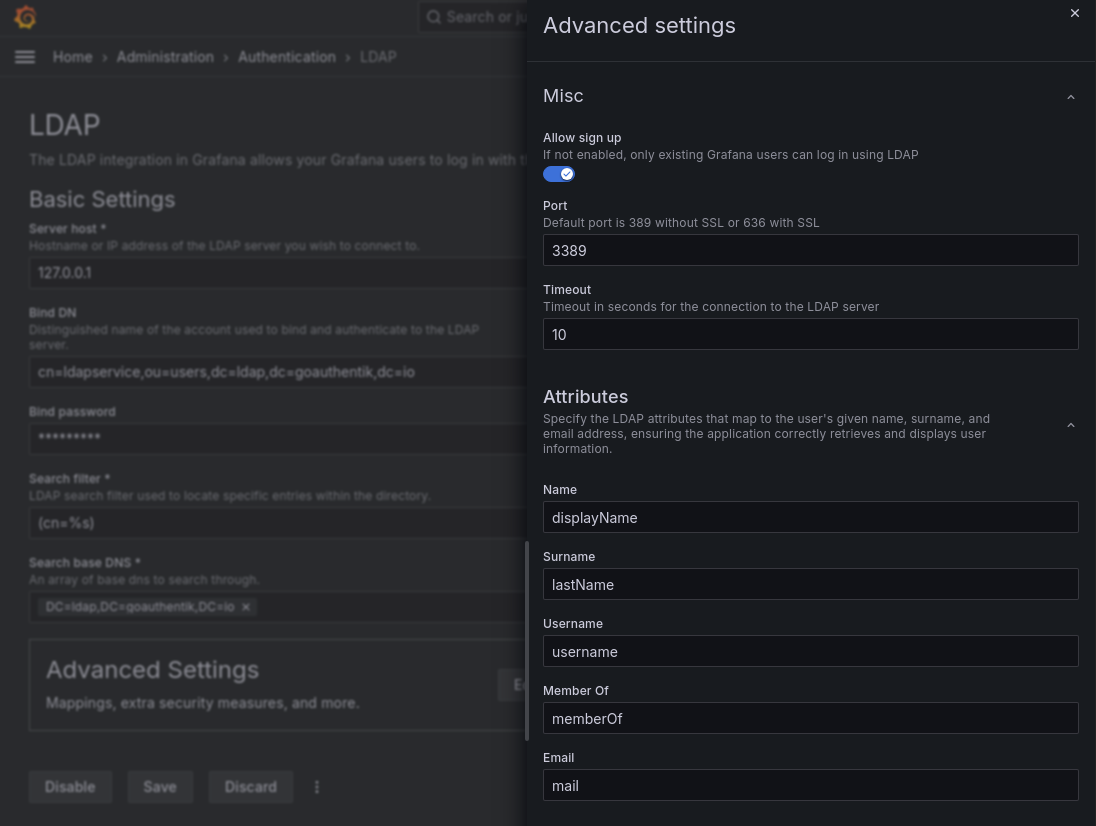
Use the new UI to set up your LDAP server as an Identity Provider, to smooth out the setup process and get quick confirmation that it works properly.
The new user interface makes it much clearer what each option does, and setting up the various configurations is now more transparent. Also, you no longer need to restart the Grafana instance for the new settings to take effect.
To use LDAP in the UI, enable the feature toggle ssoSettingsLDAP.
Developers: Support RBAC in Plugins
Generally available in all editions of Grafana
We’re excited to announce that plugins can now leverage Grafana’s role based access control to define their own roles and permissions in order to control access to their routes.
To define roles and their default assignments, plugin developers need to add a roles section to their plugin.json file. Grafana will automatically register these roles and assign them to the corresponding basic roles: Viewer, Editor, Admin, and Grafana Admin.
Following is an example of defining two RBAC plugin roles and assigning them to Admins and Viewers (and thus Editors and Admins) by default:
"roles": [
  {
    "role": {
      "name": "Patents Reader",
      "description": "Read patents",
      "permissions": [
        {"action": "grafana-appwithrbac-app.patents:read"}
      ]
    },
    "grants": ["Admin"]
  },
  {
    "role": {
      "name": "Research papers Reader",
      "description": "Read research papers",
      "permissions": [
        {"action": "grafana-appwithrbac-app.papers:read"}
      ]
    },
    "grants": ["Viewer"]
  }
]
Protecting includes and routes is also straight forward, and can be done through the new action and reqAction field of these sections of the plugin.json file.
Plugin example
If you’d like to test this and explore RBAC for plugins further, refer to this plugin example for guidance.
Known limitation
Plugins permissions are currently restricted to actions without scopes.


