View alert rules
The Alert rules list view page lists all existing recording and alert rules. The rules are organized in a hierarchical structure, from folder -> rule group -> rules.
To access the Alert rules page, click Alerts & IRM -> Alerting -> Alert rules.
Select a group to expand it and view the list of alert rules within that group.
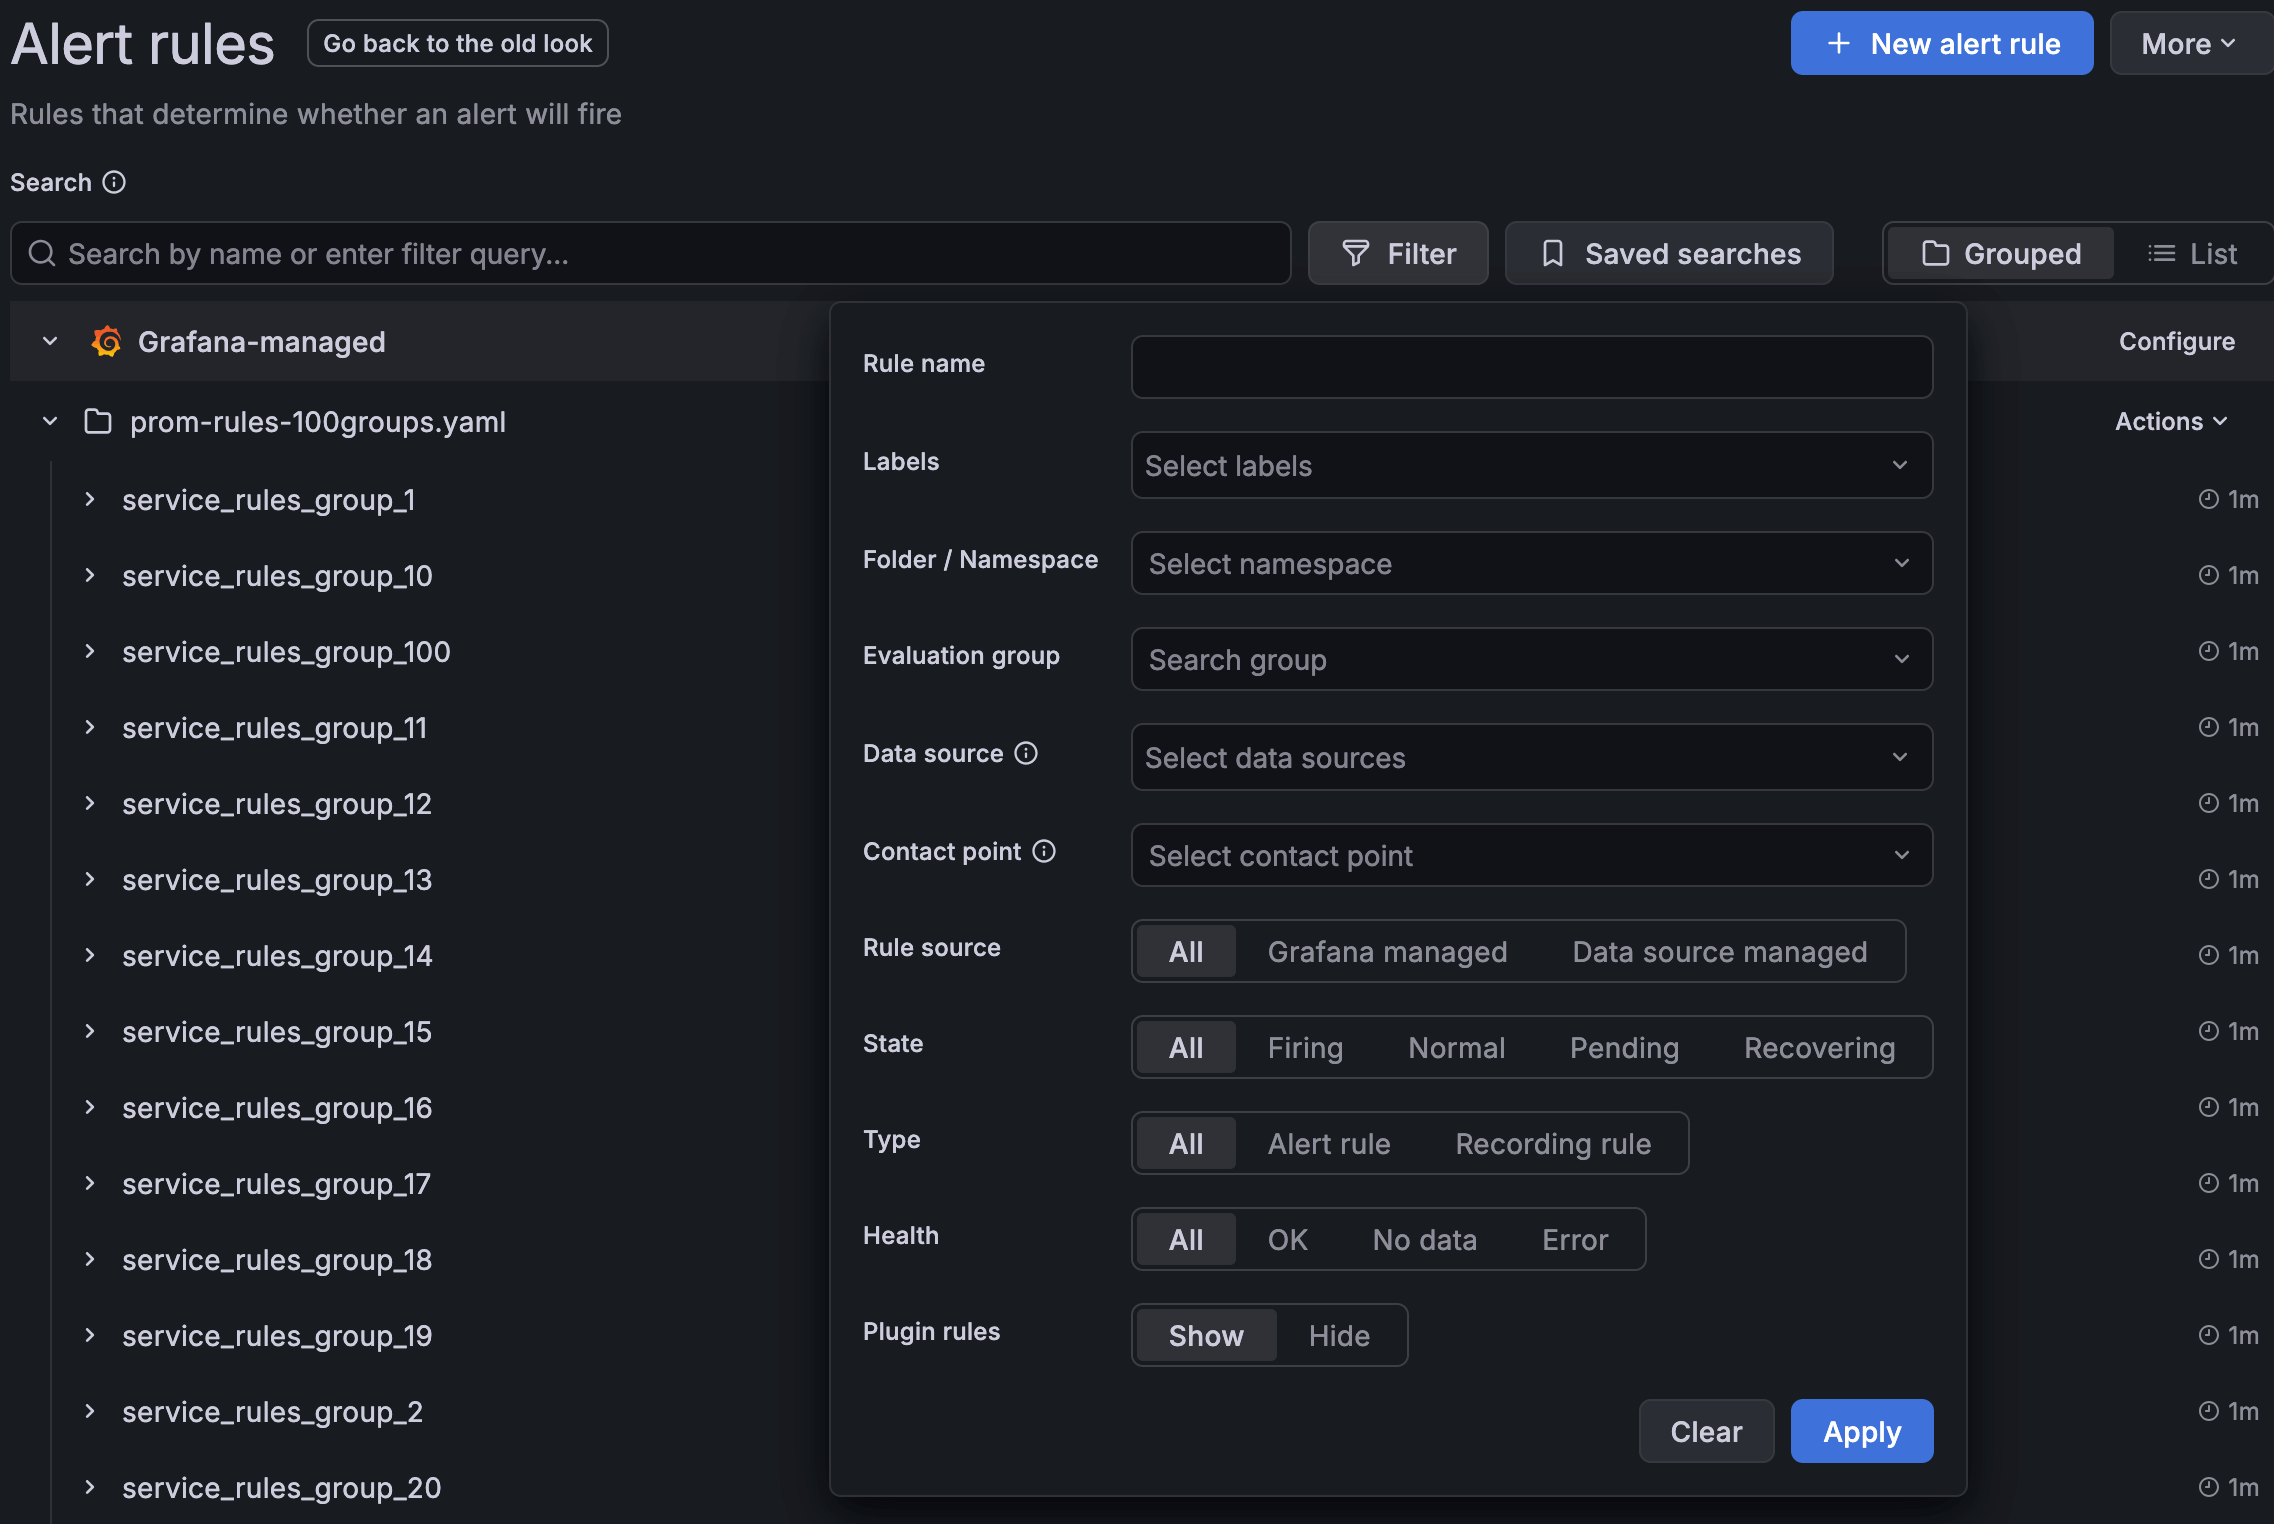
The list view includes a number of filters to simplify managing large volumes of alerts.
Filter and save searches
Click the Filter button to open the filter popup. You can filter by name, label, folder/namespace, evaluation group, data source, contact point, rule source, rule state, rule type, and the health of the alert rule from the popup menu. Click Apply at the bottom of the filter popup to enact the filters as you search.
Click the Saved searches button to open the list of previously saved searches, or click + Save current search to add your current search to the saved searches list. You can also rename a saved search or set it as a default search. When you set a saved search as the default search, the Alert rules page opens with the search applied.
Search syntax
The search input accepts a structured key:value syntax. The key on the left of the colon is the filter type, and the value on the right is what you want to match. Use quotation marks around values that contain spaces, for example rule:"High CPU usage".
The following filter types are supported:
datasourcenamespacelabelgrouprulestatetypehealth
For example:
label:severityfilters rules by theseveritylabel.health:errorfilters rules whose health is in an error state.rule:"High CPU usage"filters rules by name.
You can combine multiple filters in a single search. Any text entered without a key: prefix is treated as a query that filters alert rules by name.
Match labels with regular expressions
The label filter accepts Prometheus-style matchers, so you can match label values with regular expressions instead of exact strings. The other filter types don’t support regular expressions.
A label matcher uses the form label:<KEY><OPERATOR><VALUE>. The following operators are supported:
=: matches rules whose label value is exactly equal to the value.!=: matches rules whose label value isn’t equal to the value.=~: matches rules whose label value matches the regular expression.!~: matches rules whose label value doesn’t match the regular expression.
For example:
label:severity=~crit.*matches rules where theseveritylabel matches the regular expression, such ascriticalorcrit-high.label:team!~fe.*matches rules where theteamlabel doesn’t start withfe.
Wrap the matcher in quotation marks when the key or value contains spaces or special characters, for example label:"team=~fe.*devs".
Regular expressions use RE2 syntax and are fully anchored, so the pattern must match the entire label value. Use .* or .+ to match part of a value, for example label:severity=~.*crit.*. Matching is case-sensitive by default. To match without case sensitivity, add the (?i) inline flag, for example label:severity=~(?i)critical.
Label matchers apply to both the alert rule’s labels and the labels on its alert instances, so a rule matches when either set of labels satisfies the matcher. For labels whose values are set by Go templates, the matcher runs against the rendered static value, not the template expression, so you can’t use a template query to find a match.
The search input and the Filter popup are kept in sync, so changes made in either place are reflected in the other.
Change alert rules list view
You can also change how the rule list is displayed using the View as option.
Grouped: Displays rules grouped in a hierarchical structure, from folder/namespace, to evaluation group, to the individual rules. This is the default view.
List: Displays all rules in a flat, unpaginated list.
For details on how rule states and alert instance states are displayed, refer to View alert state.
View, compare and restore alert rules versions.
To view, compare, or restore previous versions for an alert rule, complete the following steps.
- Navigate to Alerts & IRM -> Alerting -> Alert rules.
- Select an alert rule and click View.
- Click the Versions tab.
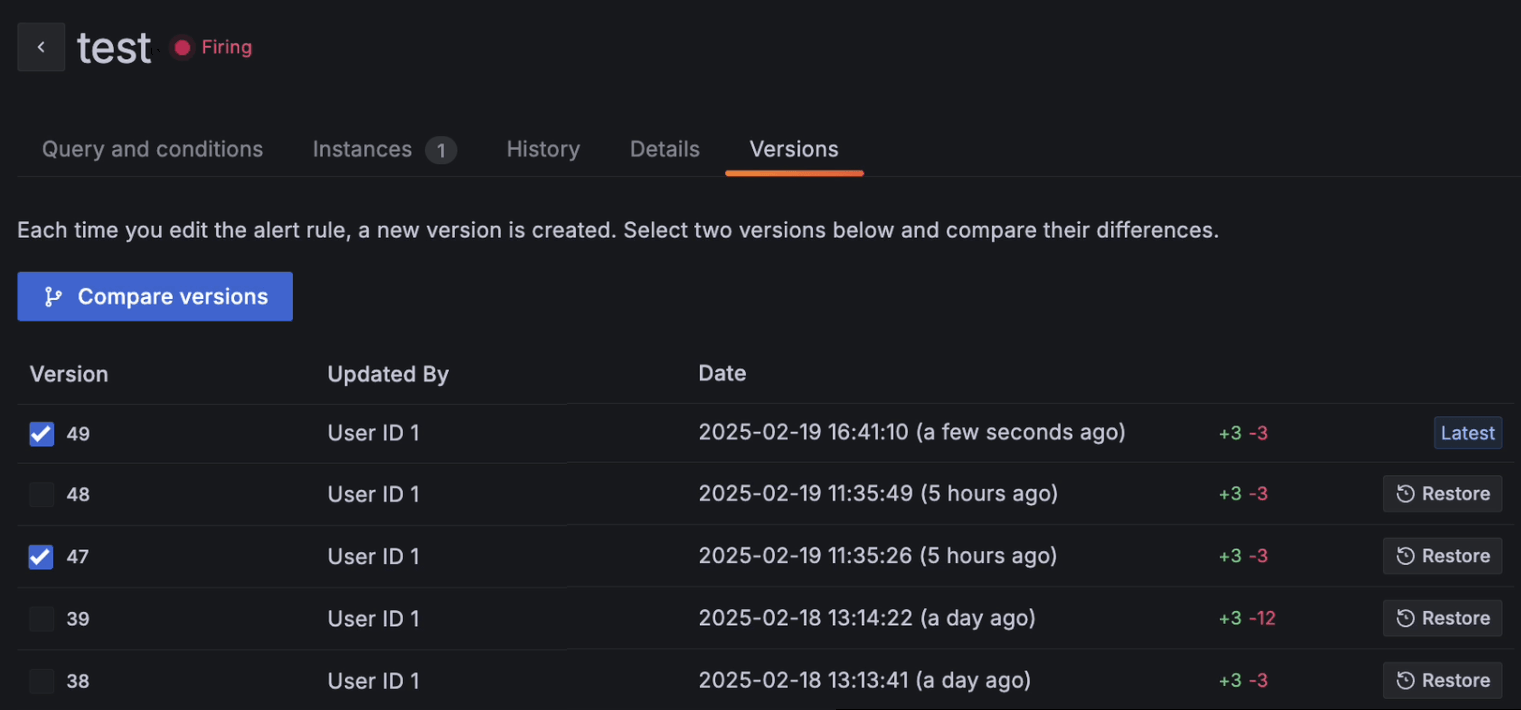
The page displays a list of the previous rule versions.
On the Alert rule’s Versions page you can view, compare and restore the previous rule versions.
Note
The alert rule does not guarantee sequential version increases.
In Grafana OSS and Enterprise, the number of alert rule versions can be limited using the
rule_version_record_limitoption. In Grafana Cloud, free users are allowed a maximum of 10 alert rule versions, while paid users have a maximum of 100 stored alert rule versions.
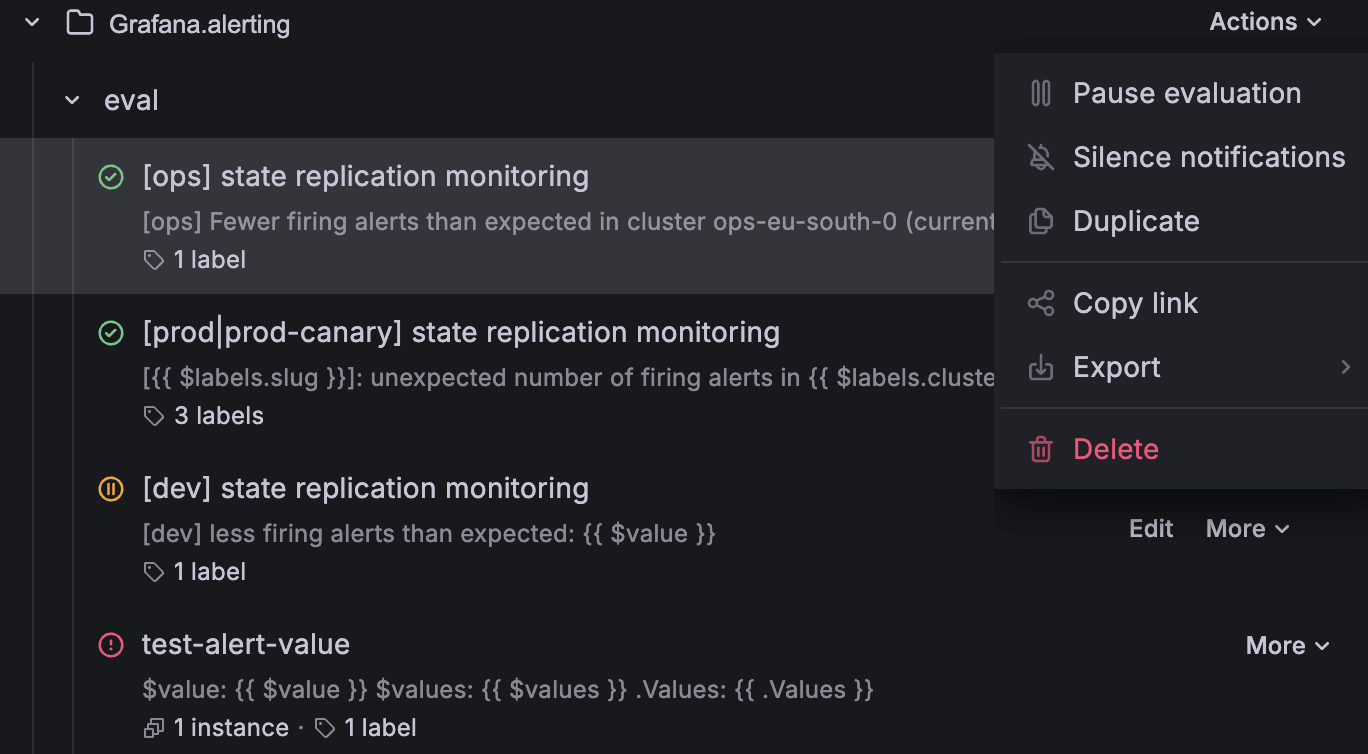
Bulk pause or resume alert rules evaluations within a folder
Admin users can pause or resume all of the alert rules evaluations within a folder. To pause or resume all the alert rules evaluations in a folder, click the menu icon and select Pause all rule evaluation or Resume all rule evaluation.
Bulk delete all alert rules within a folder
Admin users can delete all of the alert rules within a folder. To delete all the alert rules in a folder, click the menu icon and select Delete. Then type “Delete” into the field and click Delete to confirm the bulk deletion.
Permanently delete or restore deleted alert rules
Only users with an Admin role can restore deleted Grafana-managed alert rules. After an alert rule is restored, it is restored with a new, different UID from the one it had before.
- Go to Alerts & IRM -> Alerting -> Alert rules, then click the Recently deleted tab.
- Click the Restore button to restore the alert rule or click Delete permanently to delete the alert rule.
Note
Deleted alert rules are stored for 30 days. Grafana Enterprise and OSS users can adjust the length of time for which the rules are stored can be adjusted in the Grafana configuration file’s
[unified_alerting].deleted_rule_retentionfield. For an example of how to modify the Grafana configuration file, refer to the documentation example here.


