
Important: This documentation is about an older version. It's relevant only to the release noted, many of the features and functions have been updated or replaced. Please view the current version.
Reporting
Reporting allows you to automatically generate PDFs from any of your dashboards and have Grafana email them to interested parties on a schedule. This is available in Grafana Cloud Pro and Advanced and in Grafana Enterprise.
If you have Fine-grained access Control enabled, for some actions you would need to have relevant permissions. Refer to specific guides to understand what permissions are required.
Any changes you make to a dashboard used in a report are reflected the next time the report is sent. For example, if you change the time range in the dashboard, then the time range in the report changes as well.
Requirements
- SMTP must be configured for reports to be sent. Refer to SMTP in Configuration for more information.
- The Image Renderer plugin must be installed or the remote rendering service must be set up. Refer to Image rendering for more information.
Access control
When Fine-grained access control is enabled, you need to have the relevant Permissions to create and manage reports.
Create or update a report
Only organization admins can create reports by default. You can customize who can create reports with fine-grained access control.
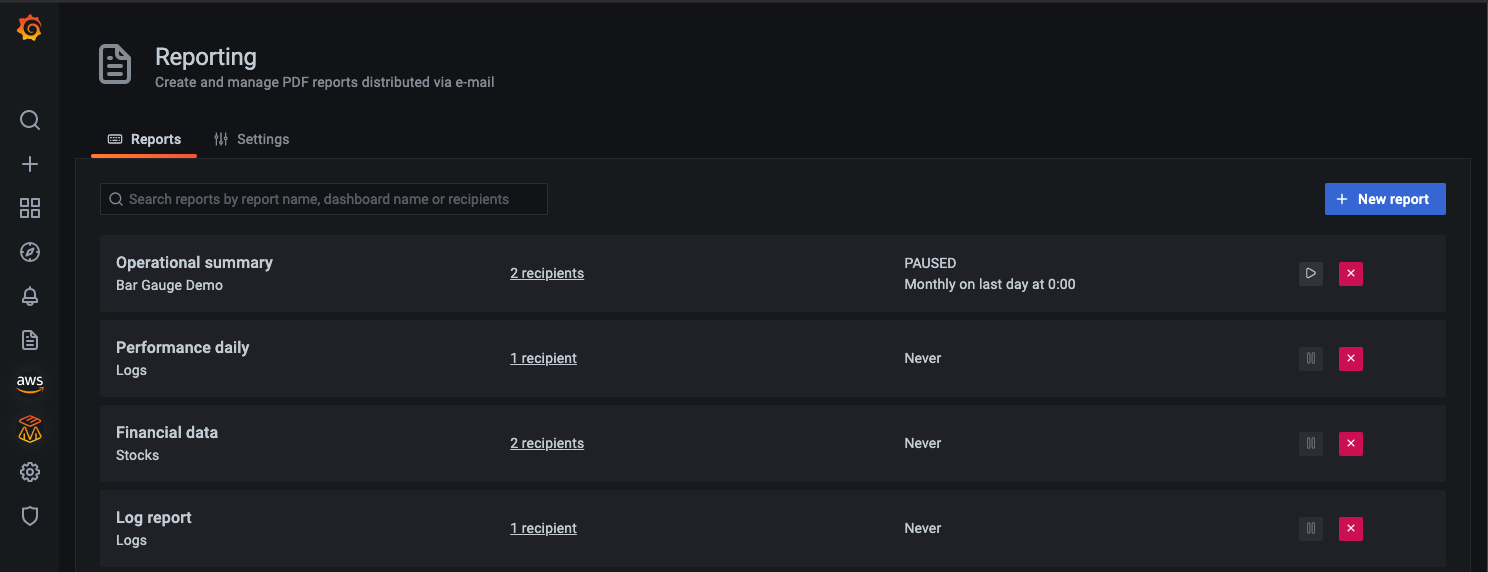
- Click on the reports icon in the side menu. The Reports tab allows you to view, create, and update your reports.
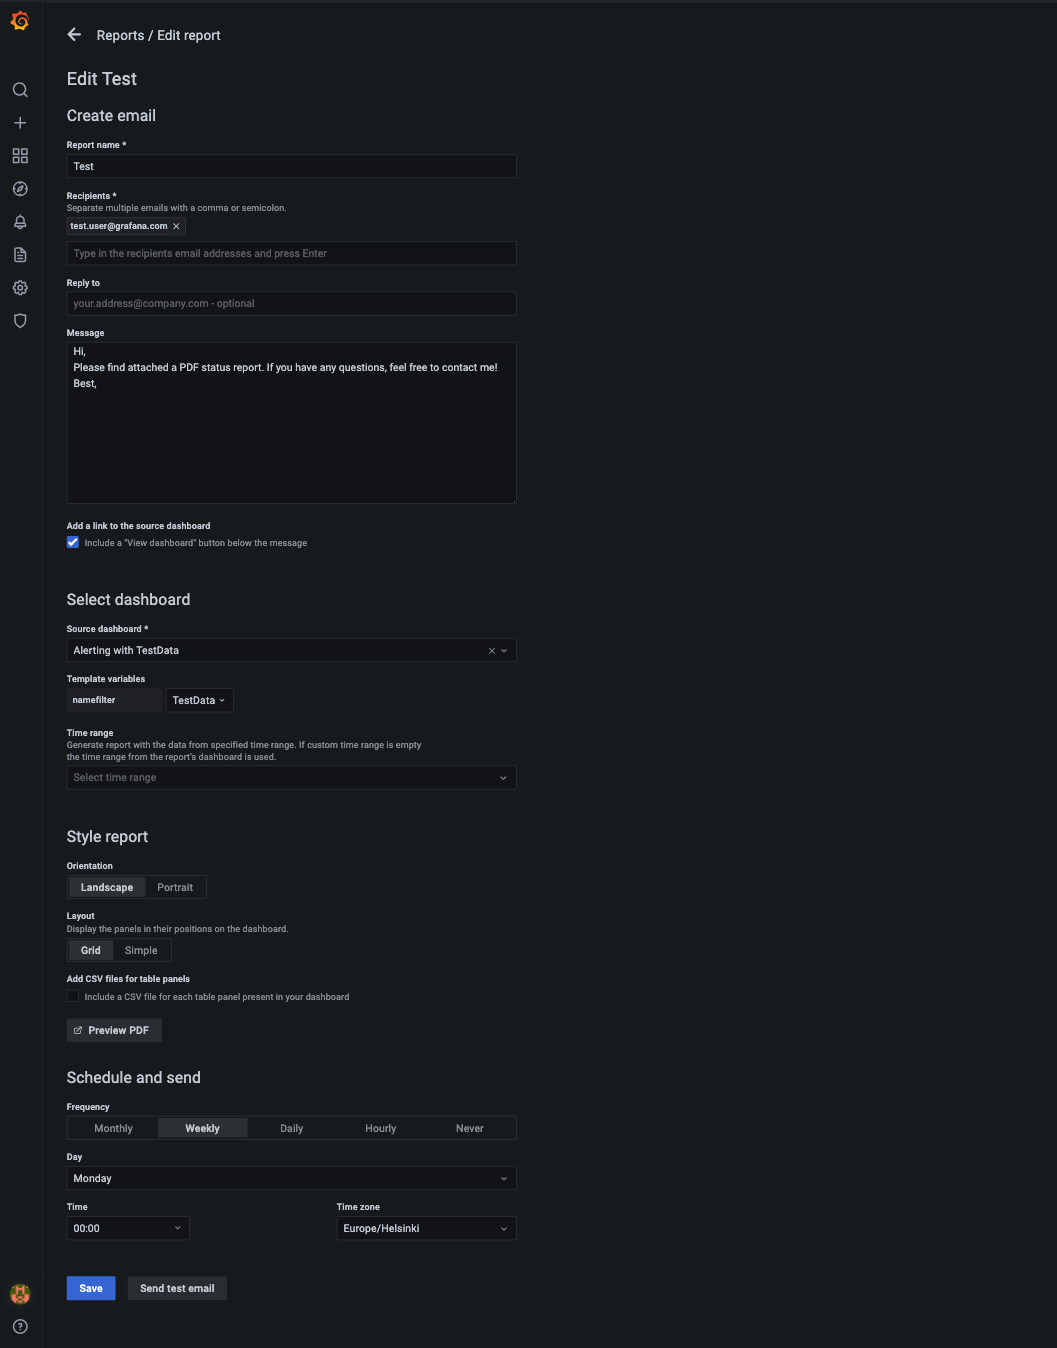
- Enter report information. All fields are required unless otherwise indicated.
- Report name - Name of the report as you want it to appear in the Reports list. It’s also used as the email subject.
- Recipients - Enter the emails of the people or teams that you want to receive the report, separated by commas or semicolons.
- Reply to - (optional) The address that will appear in the Reply to field of the email.
- Message - (optional) Message body in the email with the report.
- Include a dashboard link - Include a link to the dashboard from within the report email.
- Source dashboard - Select the dashboard to generate the report from.
- Time range - (optional) Use custom time range for the report. For more information check Report time range.
- Select an orientation for the report: Portrait or Landscape.
- Select a layout for the generated report: Simple or Grid. The simple layout renders each panel as full-width across the PDF. The grid layout renders the PDF with the same panel arrangement and width as the source dashboard.
- Add a CSV file of table panel data: check this box to attach a CSV file to the report email for each table panel on the dashboard.
- Preview PDF View a rendered PDF with the options you have selected.
- Enter scheduling information. Options vary depending on the frequency you select.
- Save the report.
- Send test email to verify that the whole configuration is working as expected. You can choose to send this email to the recipients configured for the report, or to a different set of email addresses only used for testing.
Choose template variables
Note: Available in Grafana Enterprise version 7.5+ (behind
reportVariablesfeature flag) and Grafana Enterprise version 8+ without a feature flag.
You can configure report-specific template variables for the dashboard on the report page. The variables that you select will override the variables from the dashboard, and they are used when rendering a PDF file of the report. For detailed information about using template variables, refer to the Templates and variables section.
Note: The query variables saved with a report might go out of date if the results of that query change. For example, if your template variable queries for a list of hostnames and a new hostname is added, then it will not be included in the report. If that happens, the selected variables will need to be manually updated in the report. If you select the
Allvalue for the template variable or if you keep the dashboard’s original variable selection, then the report will stay up-to-date as new values are added.
Render a report with panels or rows set to repeat by a variable
Note: Available in Grafana Enterprise v8+.
You can include dynamic dashboards with panels or rows, set to repeat by a variable, into reports. For detailed information about setting up repeating panels or rows in dashboards, refer to the Repeat panels or rows section.
Caveats:
- Rendering repeating panels for dynamic variable types (e.g.
queryvariables) with selectedAllvalue is currently not supported. As a workaround, it is possible to individually select all the values instead. - If you select different template variables in a report for a dashboard with repeating rows, you might see empty space or missing values at the bottom of the report. This is because the dimensions of the panels from the dashboard are used to generate the report. To avoid this issue, use the dashboard’s original template variables for the report, or make a copy of the dashboard, select the new set of template variables, and generate a report based on the copied dashboard.
- Rendering of the repeating panels inside collapsed rows in reports is not supported.
Report time range
Setting custom report time range is available in Grafana Enterprise v7.2+.
By default, reports use the saved time range of the dashboard. Changing the time range of the report can be done by:
- Saving a modified time range to the dashboard.
- Setting a time range via Time range field in the report form. If specified, then this custom time range overrides the one from the report’s dashboard.
The page header of the report displays the time range for the dashboard’s data queries. Dashboards set to use the browser’s time zone will use the time zone on the Grafana server.
If the time zone is set differently between your Grafana server and its remote image renderer, then the time ranges in the report might be different between the page header and the time axes in the panels. To avoid this, set the time zone to UTC for dashboards when using a remote renderer. Each dashboard’s time zone setting is visible in the time range controls.
Layout and orientation
We’re actively working on developing new report layout options. Contact us if you would like to get involved in the design process.
| Layout | Orientation | Support | Description | Preview |
|---|---|---|---|---|
| Simple | Portrait | v6.4+ | Generates an A4 page in portrait mode with three panels per page. | 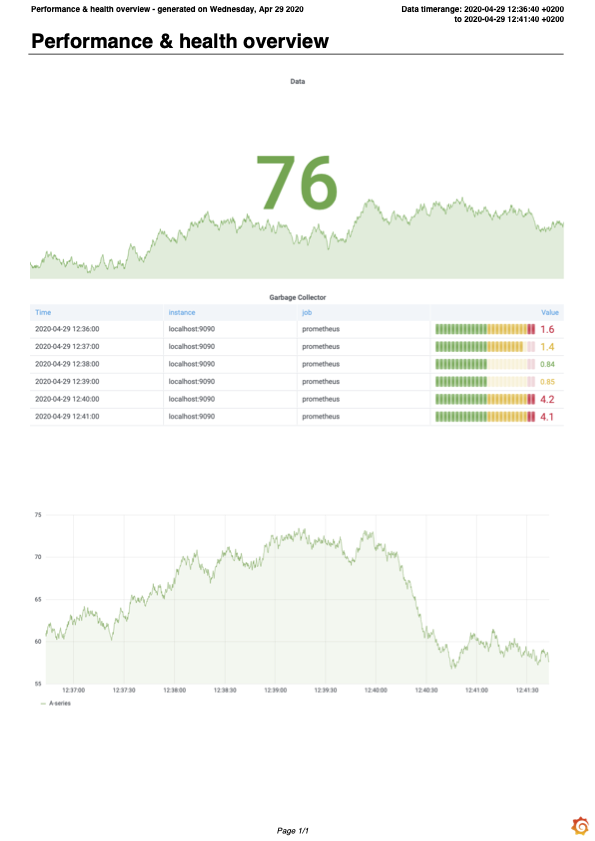 |
| Simple | Landscape | v6.7+ | Generates an A4 page in landscape mode with a single panel per page. | 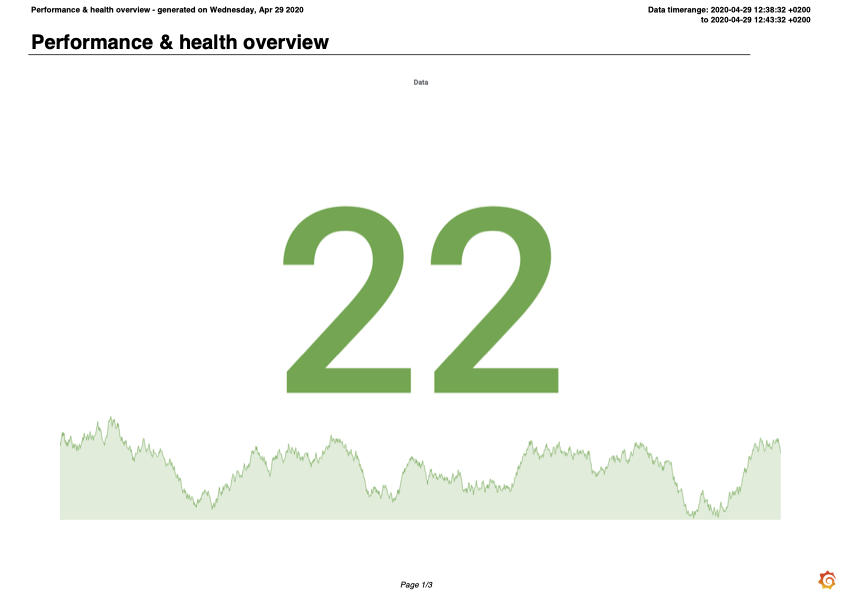 |
| Grid | Portrait | v7.2+ | Generates an A4 page in portrait mode with panels arranged in the same way as at the original dashboard. | 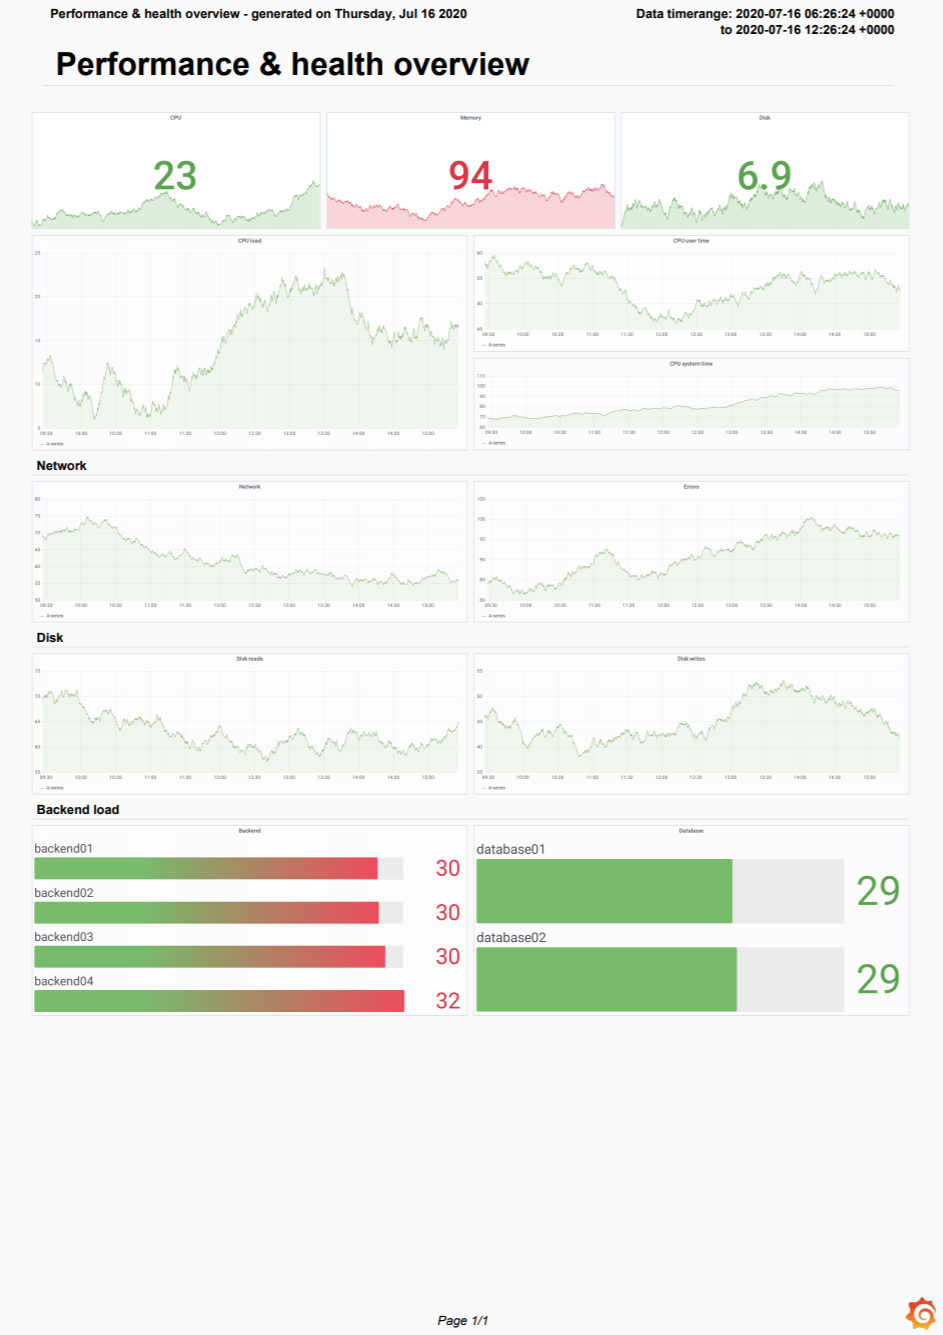 |
| Grid | Landscape | v7.2+ | Generates an A4 page in landscape mode with panels arranged in the same way as at the original dashboard. | 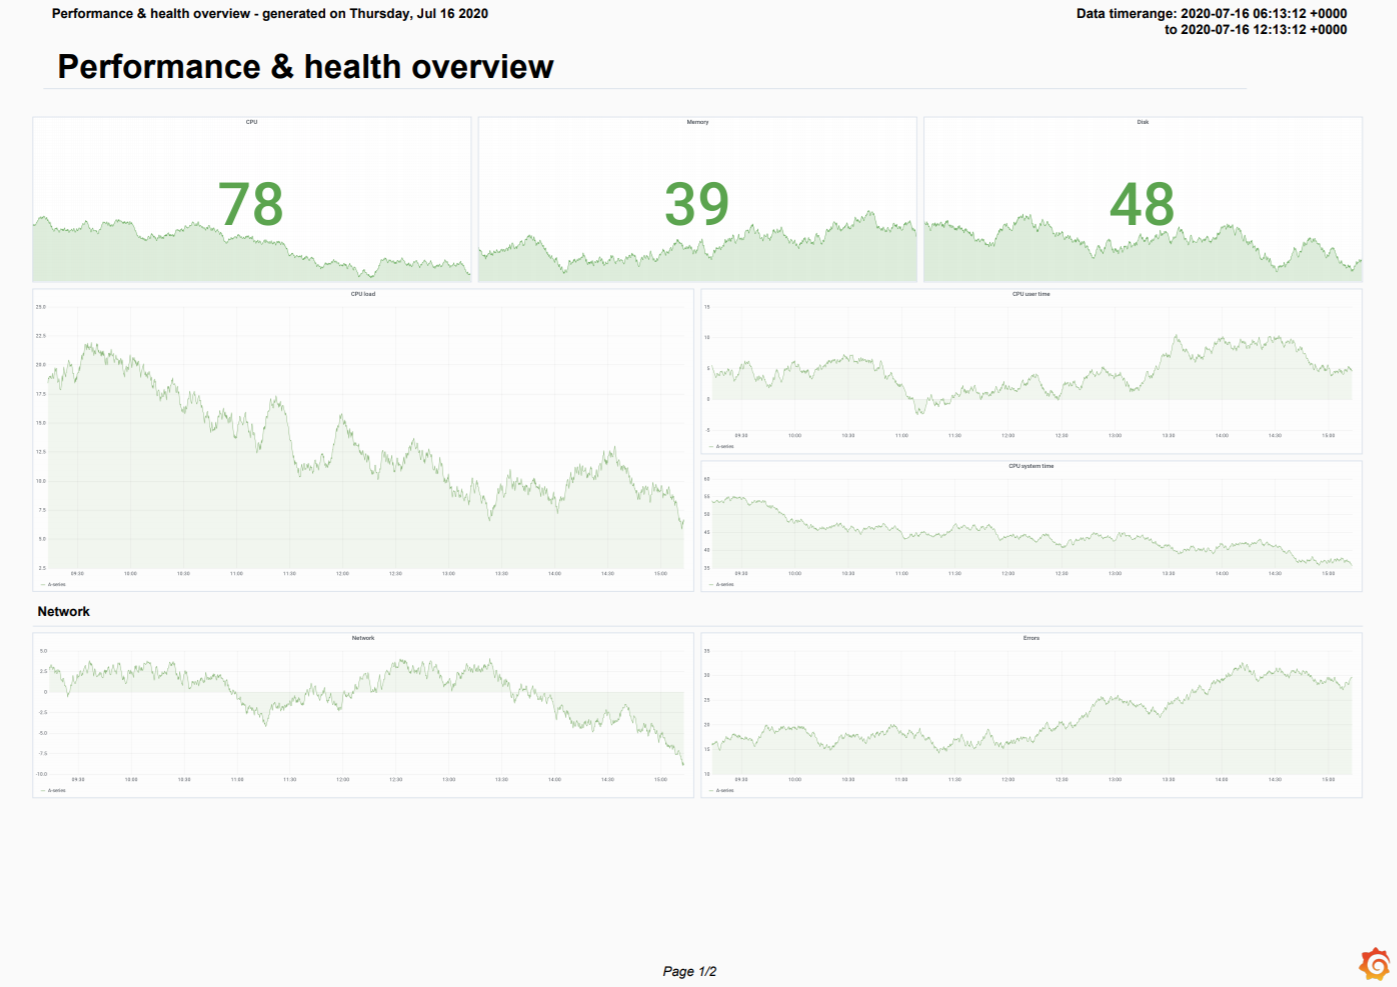 |
CSV export
Note: Only available in Grafana Enterprise v8.0+, with the Grafana image renderer plugin v3.0+.
You can attach a CSV file to the report email for each table panel on the selected dashboard, along with the PDF report. By default, CSVs larger than 10Mb won’t be sent to avoid email servers to reject the email. You can increase or decrease this limit in the reporting configuration.
This feature relies on the same plugin that supports the image rendering features.
When the CSV file is generated, it is temporarily written to the csv folder in the Grafana data folder.
A background job runs every 10 minutes and removes temporary CSV files. You can configure how long a CSV file should be stored before being removed by configuring the temp-data-lifetime setting. This setting also affects how long a renderer PNG file should be stored.
Scheduling
Scheduled reports can be sent on a monthly, weekly, daily, or hourly basis. You may also disable scheduling for when you either want to send it via the API.
All scheduling indicates when the reporting service will start rendering the dashboard. It can take a few minutes to render a dashboard with a lot of panels.
Hourly
Hourly reports are generated once per hour. All fields are required.
- At minute - The number of minutes after full hour when the report should be generated.
- Time zone - Time zone to determine the offset of the full hour. Does not currently change the time in the rendered report.
Daily
Daily reports are generated once per day. All fields are required.
- Time - Time the report is sent, in 24-hour format.
- Time zone - Time zone for the Time field.
Weekly
Weekly reports are generated once per week. All fields are required.
- Day - Weekday which the report should be sent on.
- Time - Time the report is sent, in 24-hour format.
- Time zone - Time zone for the Time field.
Monthly
Only available in Grafana Enterprise v7.1+.
Monthly reports are generated once per month. All fields are required.
- Day in month - Day of the month when the report should be sent. You can select
lastfor reports that should go out on the last day of the month. - Time - Time the report is sent, in 24-hour format.
- Time zone - Time zone for the Time field.
Never
Only available in Grafana Enterprise v7.0+.
Reports which are scheduled to never be sent have no parameter and will not be sent to the scheduler. They may be manually generated from the Send test email prompt or via the Reporting API.
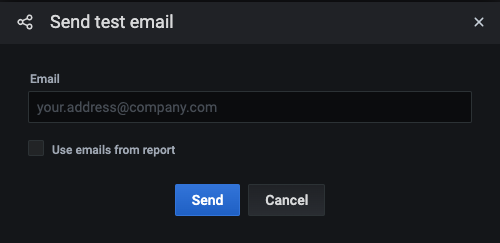
Send test email
Only available in Grafana Enterprise v7.0+.
- In the report, click Send test email.
- In the Email field, enter the email address or addresses that you want to test, separated by semicolon. If you want to use email addresses from the report, then select the Use emails from report check box.
- Click Send.
The last saved version of the report will be sent to selected emails. You can use this to verify emails are working and to make sure the report is generated and displayed as you expect.
Pause report
Note: Available in Grafana Enterprise v8+.
You can pause sending of reports from the report list view by clicking the pause icon. The report will not be sent according to its schedule until it is resumed by clicking the resume button on the report row.
Send report via the API
You can send reports programmatically with the send report endpoint in the HTTP APIs.
Rendering configuration
When generating reports, each panel renders separately before being collected in a PDF. The per panel rendering timeout and number of concurrently rendered panels can be configured.
To make a panel more legible, you can set a scale factor for the rendered images. However, a higher scale factor increases the file size of the generated PDF.
You can also specify custom fonts that support different Unicode scripts. The DejaVu font is the default used for PDF rendering.
These options are available in the configuration file.
[reporting]
# Set timeout for each panel rendering request
rendering_timeout = 10s
# Set maximum number of concurrent calls to the rendering service
concurrent_render_limit = 4
# Set the scale factor for rendering images. 2 is enough for monitor resolutions
# 4 would be better for printed material. Setting a higher value affects performance and memory
image_scale_factor = 2
# Set the maximum file size in megabytes for the CSV attachments
max_attachment_size_mb = 10
# Path to the directory containing font files
fonts_path =
# Name of the TrueType font file with regular style
font_regular = DejaVuSansCondensed.ttf
# Name of the TrueType font file with bold style
font_bold = DejaVuSansCondensed-Bold.ttf
# Name of the TrueType font file with italic style
font_italic = DejaVuSansCondensed-Oblique.ttf
Reports settings
Note: Available in Grafana Enterprise v7.2+.
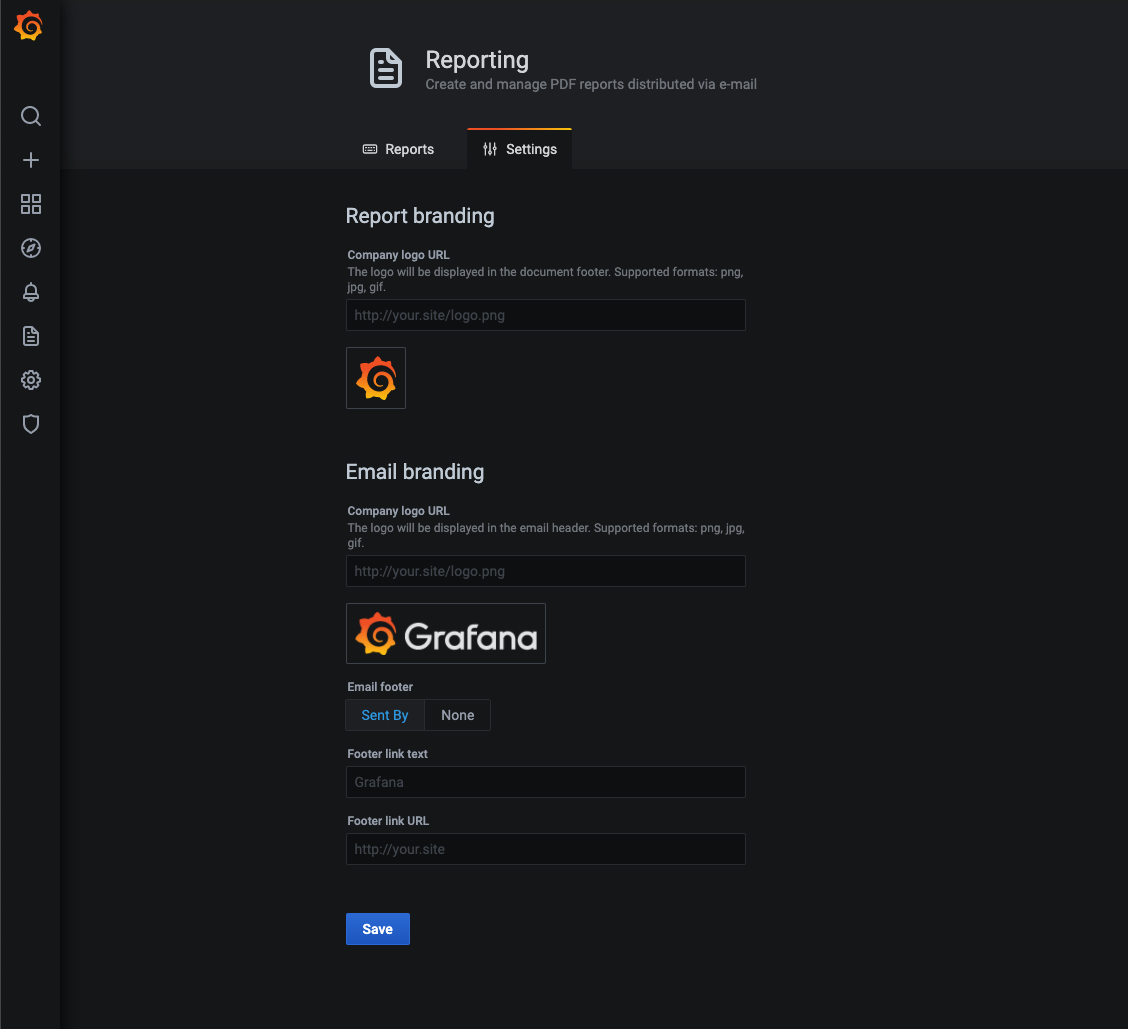
You can configure organization-wide report settings in the Settings tab on the Reporting page. Settings are applied to all the reports for current organization.
You can customize the branding options.
Report branding: Company logo URL - Company logo displayed in the report PDF. Defaults to the Grafana logo.
Email branding:
- Company logo URL - Company logo displayed in the report PDF. Defaults to the Grafana logo.
- Email footer - Toggle to enable report email footer. Select Sent by or None.
- Footer link text - Text for the link in the report email footer. Defaults to “Grafana”.
- Footer link URL - Link for the report email footer.
Troubleshoot reporting
To troubleshoot and get more log information, enable debug logging in the configuration file. Refer to Configuration for more information.
[log]
filters = report:debug
Was this page helpful?
Related resources from Grafana Labs


