
Important: This documentation is about an older version. It's relevant only to the release noted, many of the features and functions have been updated or replaced. Please view the current version.
Graph stacked time series
Note: This is a beta feature. Time series panel is going to replace the Graph panel in a future release.
This section explains how to use Time series panel field options to control the stacking of the series and illustrates what the stacking options do.
Stacking allows Grafana to display series on top of each other. Be cautious when using stacking in the visualization as it can easily create misleading graphs. You can read more on why stacking may be not the best approach here: Stacked Area Graphs Are Not Your Friend.
Use the following field settings to configure your series stacking.
Some field options will not affect the visualization until you click outside of the field option box you are editing or press Enter.
Stack series
Turn series stacking on or off.
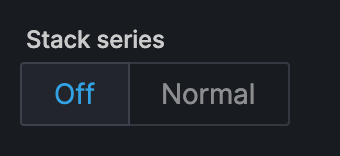
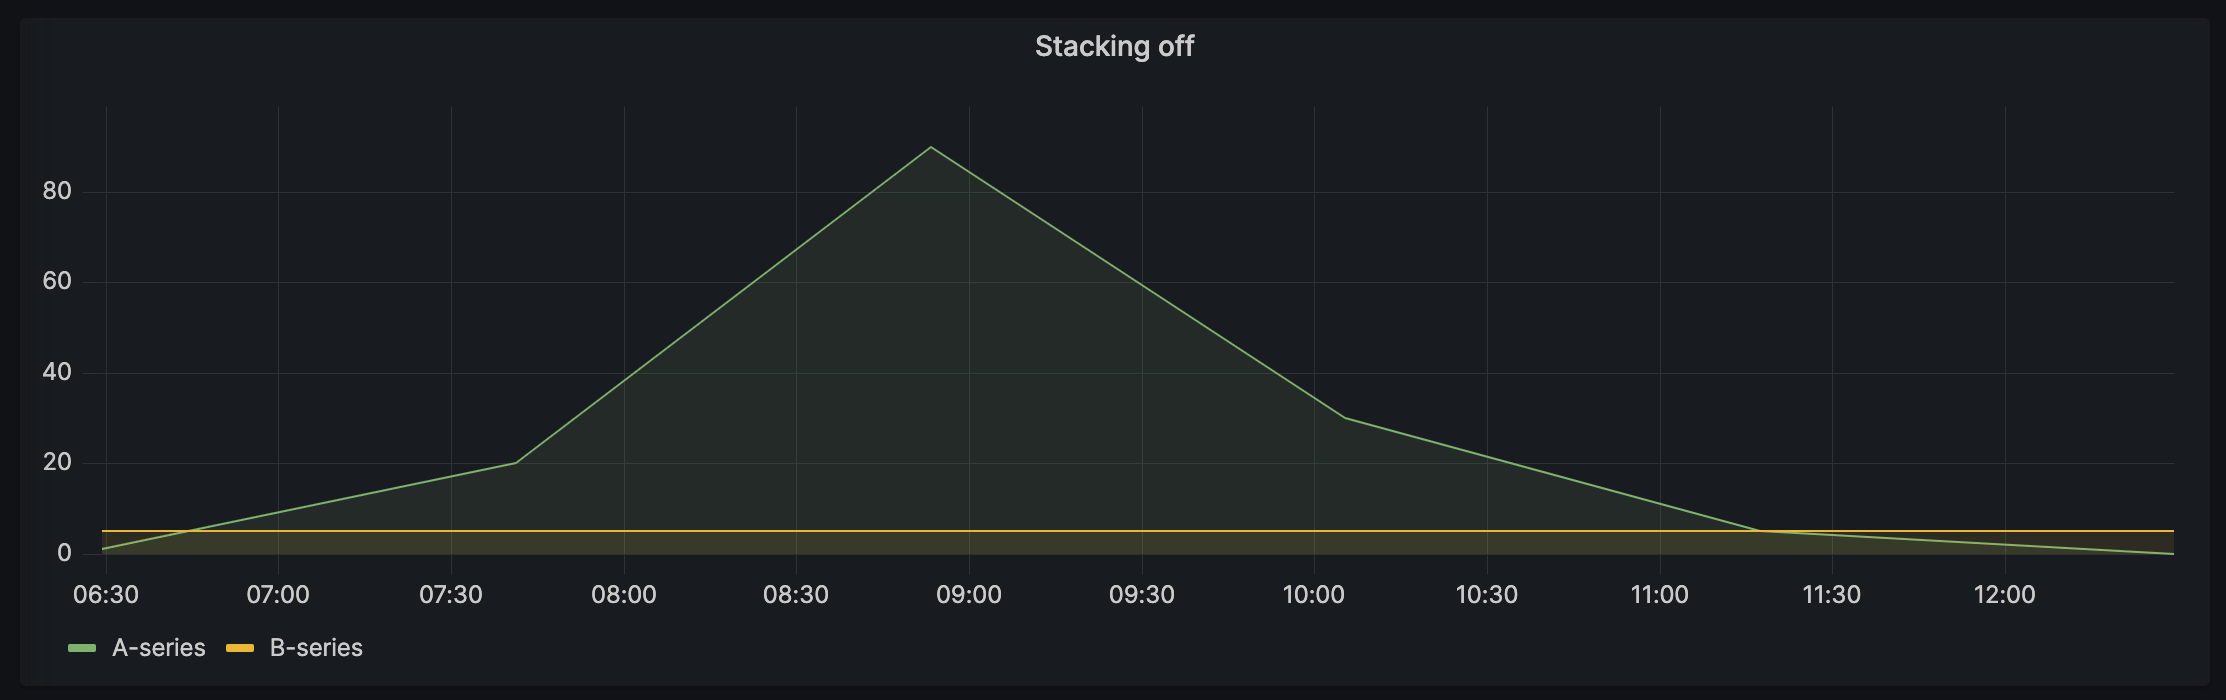
Off
Turn off series stacking. A series will share the same space in the visualization.
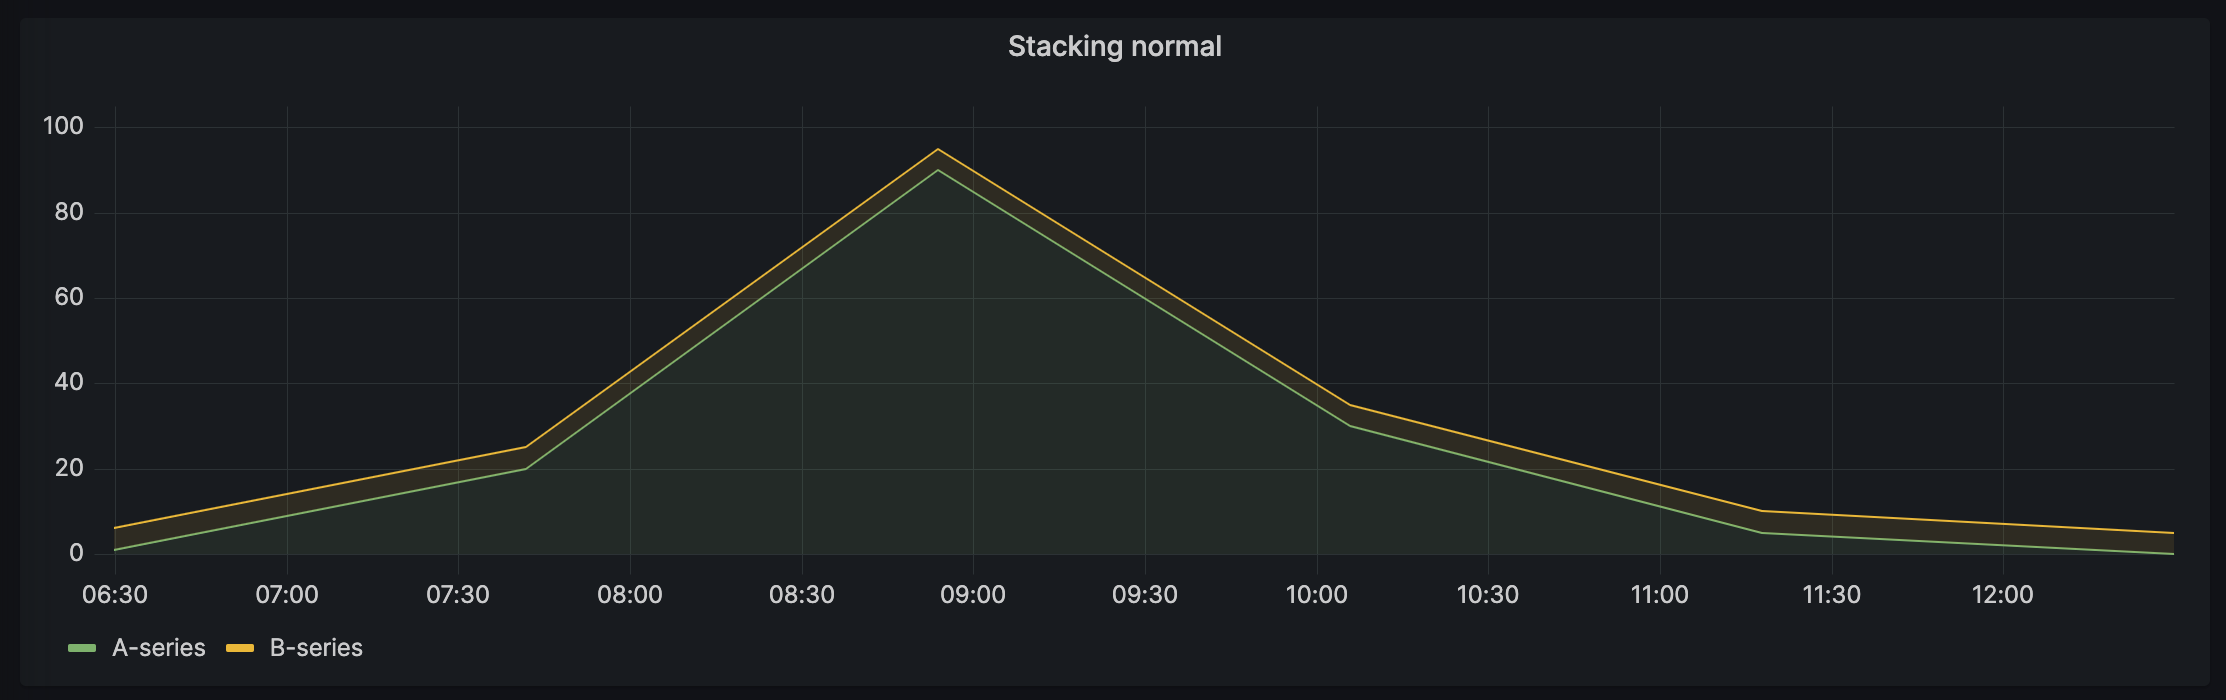
Normal
Enable stacking series on top of each other.
Stack series in groups
The stacking group option is only available as an override.
For more information about creating field overrides, refer to Field overrides.
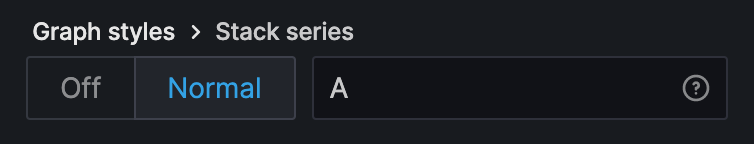
Stack series in the same group. In the Overrides section:
Create a field override for Stack series option.
![Stack series override]()
Click on Normal stacking mode.
Name the stacking group you want the series to appear in. The stacking group name option is only available when creating an override.
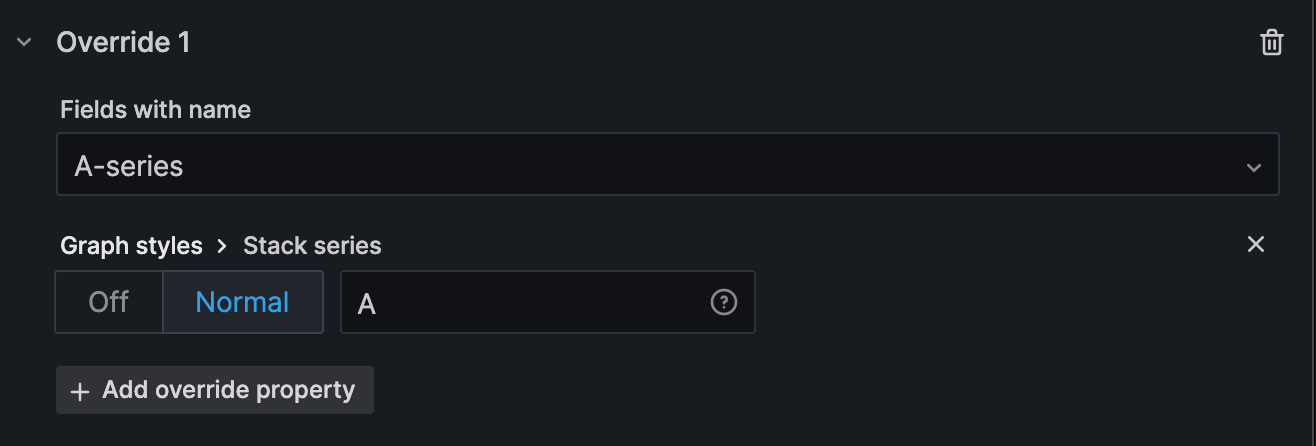
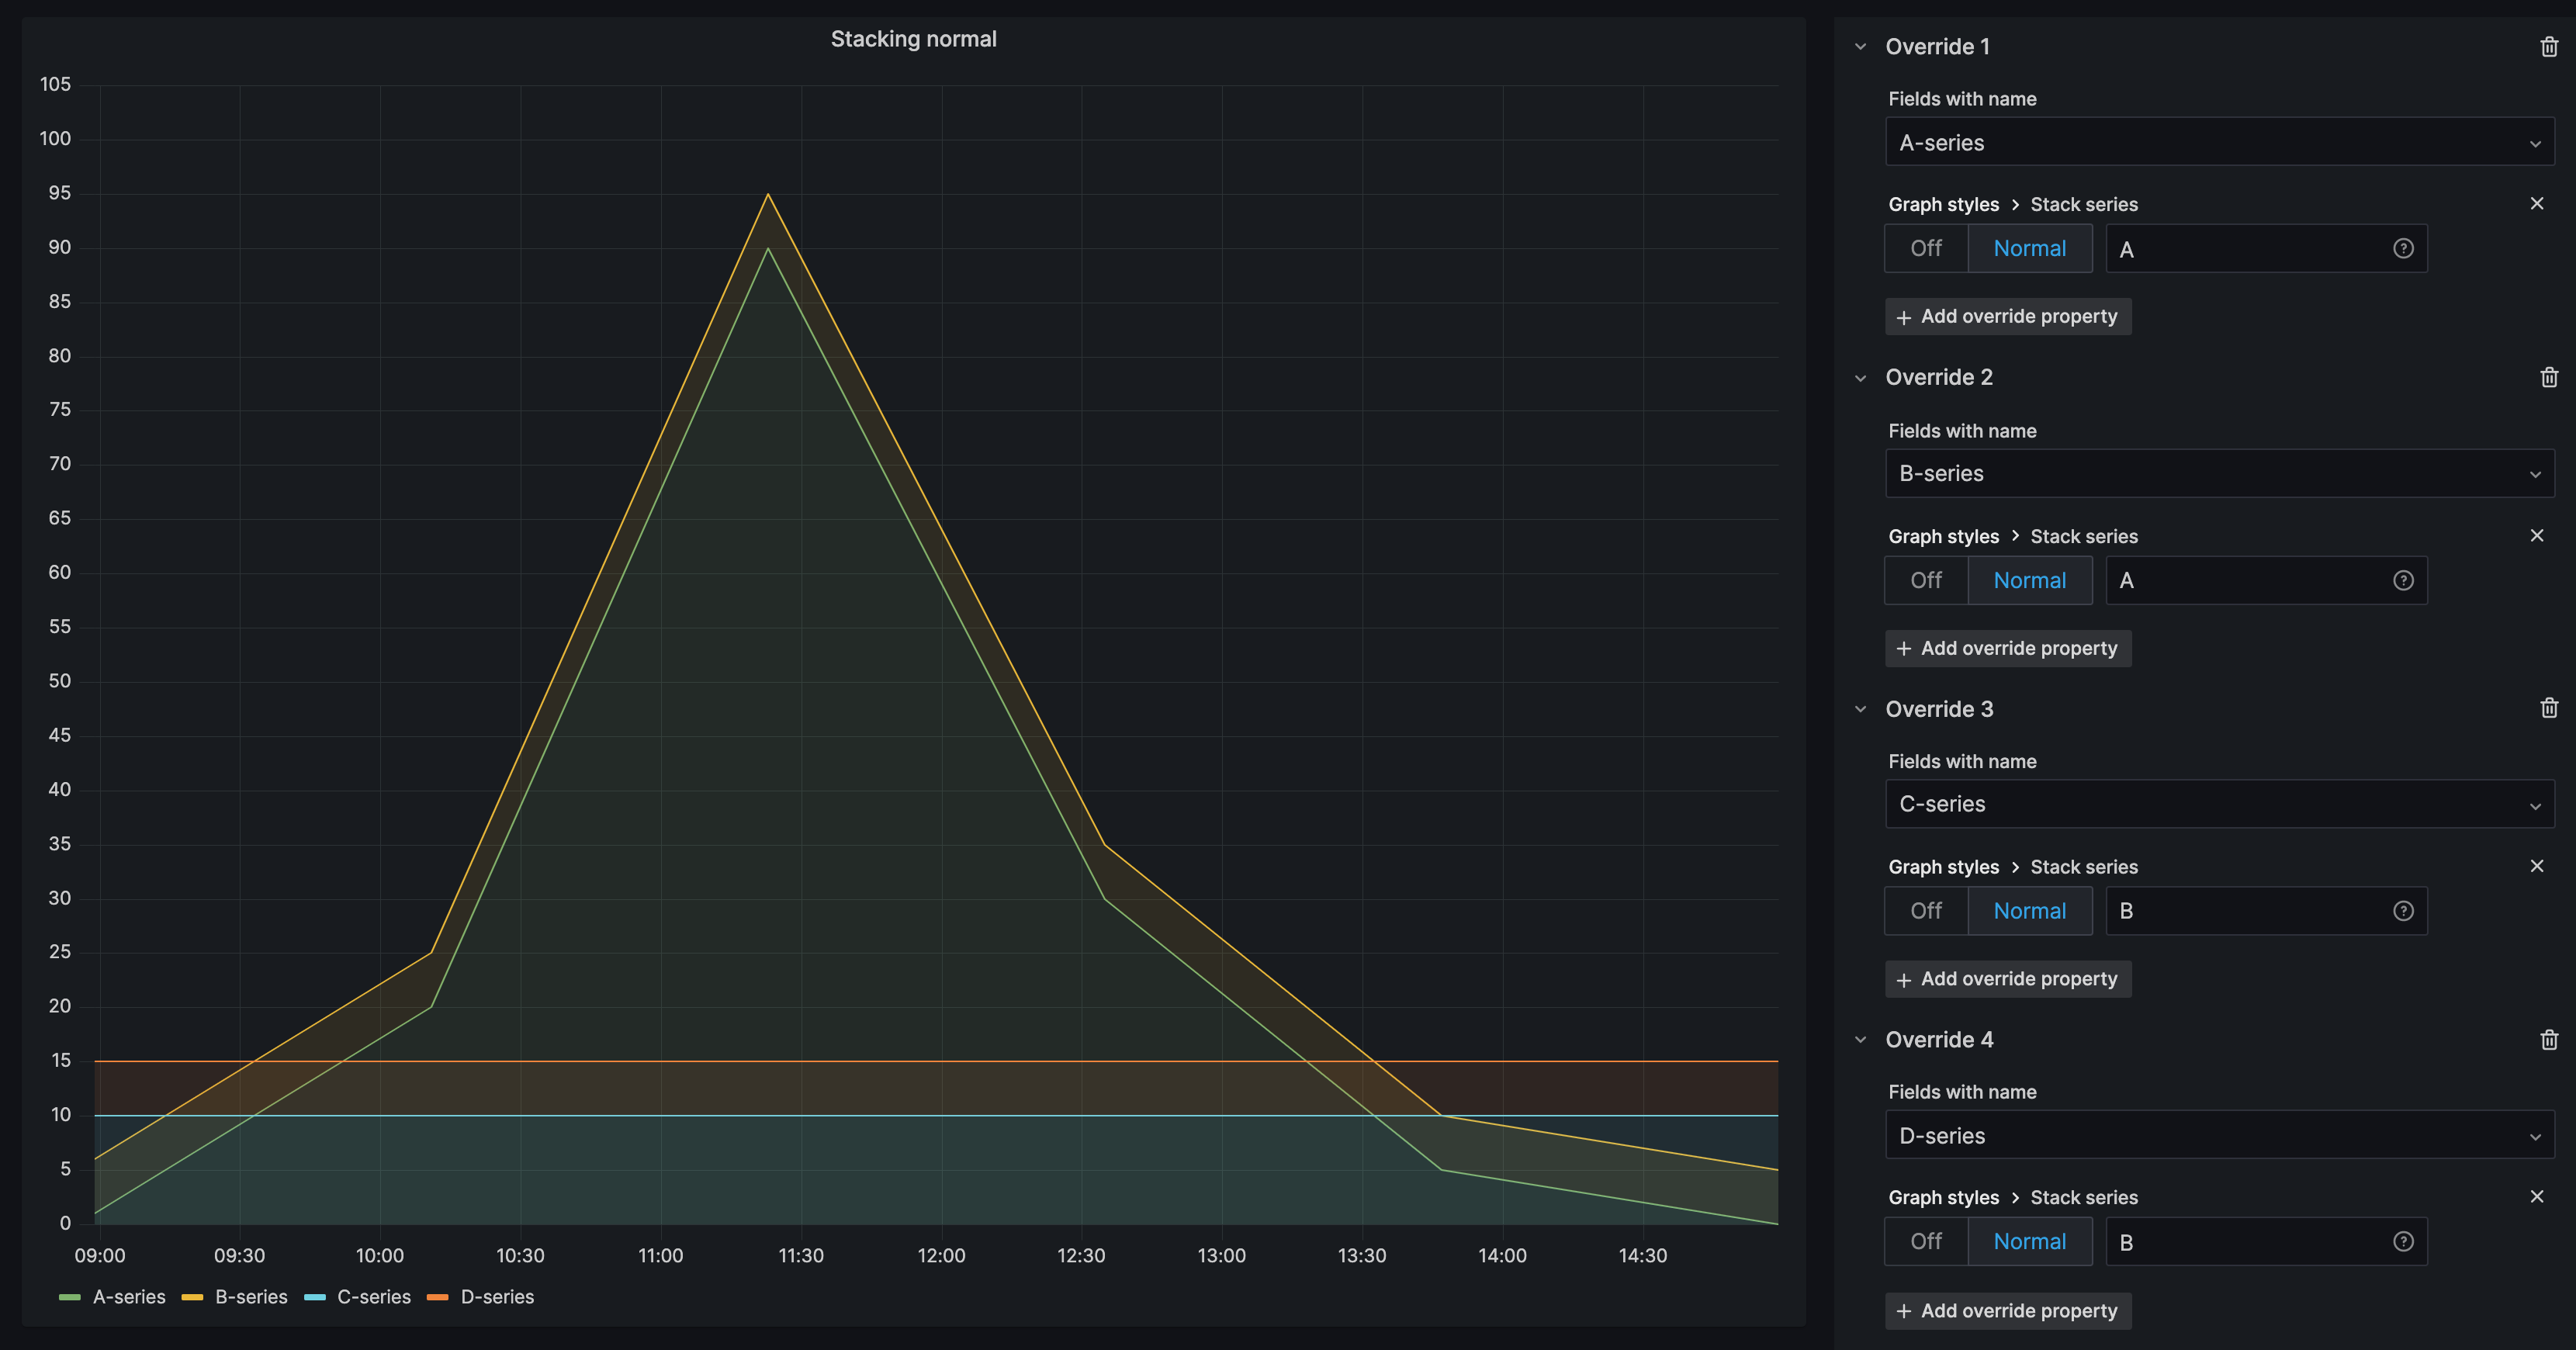
A-series and B-series stacked in group A, C-series, and D-series stacked in group B:
Was this page helpful?
Related resources from Grafana Labs


