
Important: This documentation is about an older version. It's relevant only to the release noted, many of the features and functions have been updated or replaced. Please view the current version.
Value mappings
Value mapping concept allow you to replace values or ranges in your visualizations with words or emojis.
Values mapped via value mappings will skip the unit formatting. This means that a text value mapped to a numerical value will not be formatted using the configured unit.
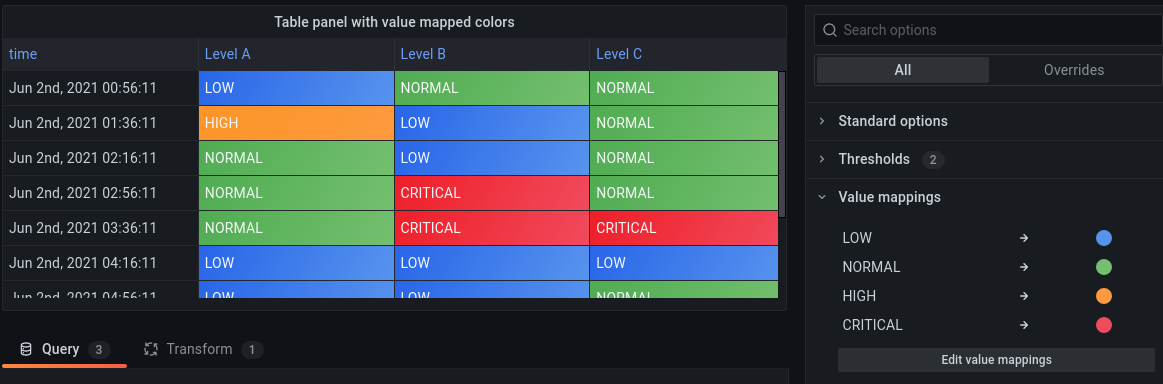
If value mappings are present in a panel, then Grafana displays a summary in the side pane of the panel editor.
Note: The new value mappings are not compatible with some visualizations, such as Graph (old), Text, and Heatmap.
Value mapping examples
Value mappings are displayed differently in different visualizations.
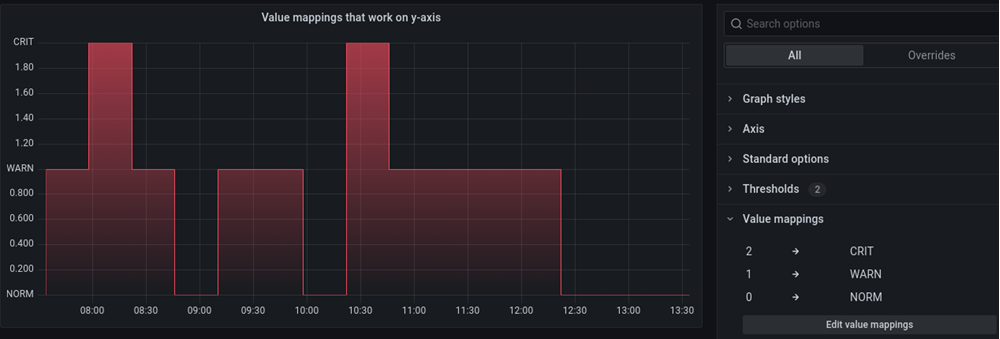
Time series example
Here’s an example showing a Time series visualization with value mappings. Value mapping colors are not applied to this visualization, but the display text is shown on the axis.
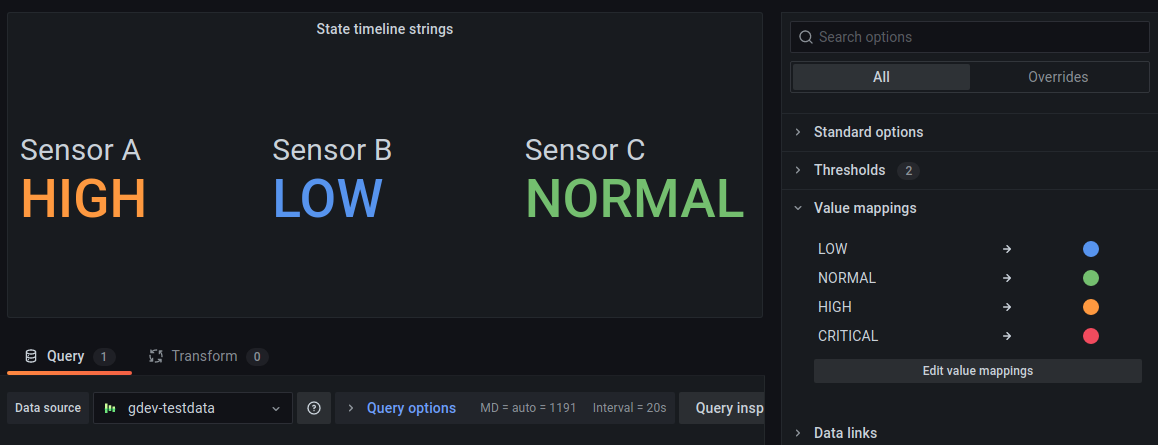
Stat example
Here’s an example showing a Stat visualization with value mappings. You might want to hide the sparkline so it doesn’t interfere with the values. Value mapping text colors are applied.
Bar gauge example
Here’s an example showing a Bar gauge visualization with value mappings. The value mapping colors are applied to the text but not the gauges.
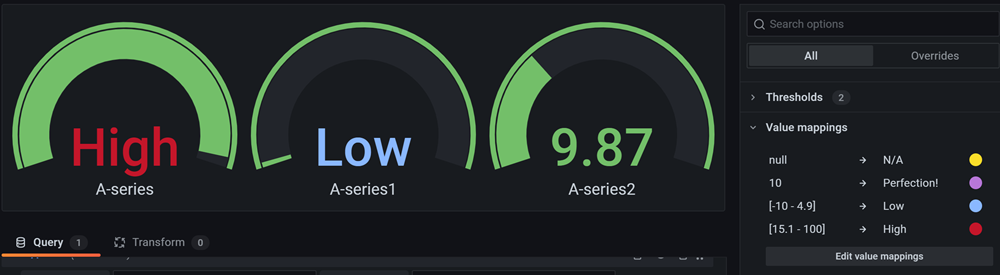
Table example
Here’s an example showing a Table visualization with value mappings. If you want value mapping colors displayed on the table, then set the cell display mode to Color text or Color background.
Value mappings fields
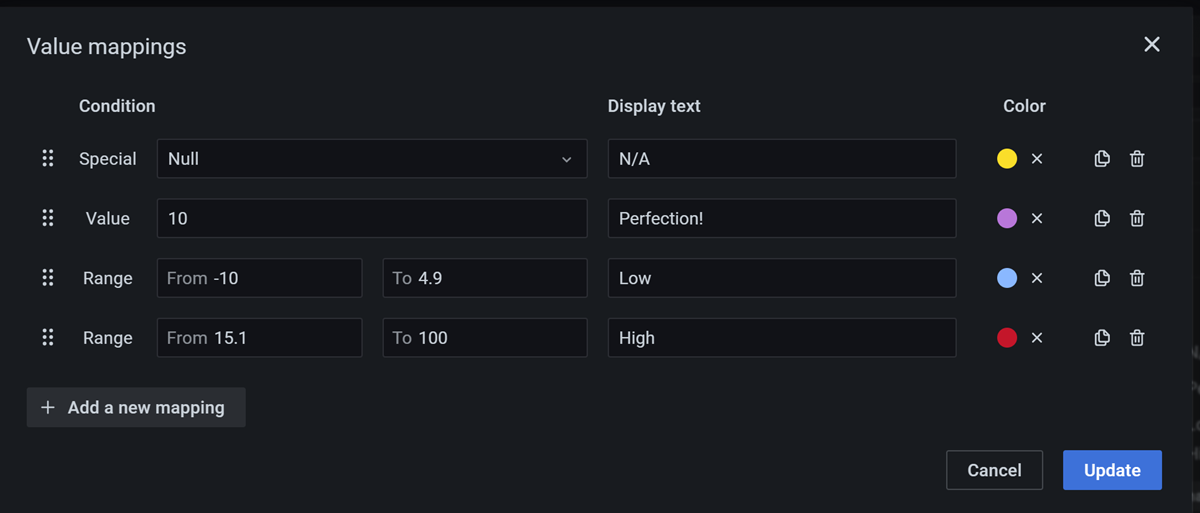
This section describes options in the Value mappings user interface.
Note: Display text and Color are both optional. If you want to only assign colors to the text values, then you can leave the display text empty and the original value is displayed.
Condition
This column lists the type of condition a value mapping is triggered by and the values.
You can map values to three different conditions:
- Value maps text values to a color or different display text. For example, if a value is
10, I want Grafana to display Perfection! rather than the number. - Range maps numerical ranges to a display text and color. For example, if a value is within a certain range, I want Grafana to display Low or High rather than the number.
- Special maps special values like
Null,NaN(not a number), and boolean values liketrueandfalseto a display text and color. For example, if Grafana encounters anull, I want Grafana to display N/A.
You can also use the dots on the left as a “handle” to drag and reorder value mappings in the list.
Display text
The display text is what Grafana displays instead of a number when the listed condition is met.
You can enter any Ascii character or emoji in this field.
Color
You can select a color to for Grafana to display the value mapping text in.
- Set color - Click Set color to see a range of recommended colors. Click Custom to choose your own color.
- Text color - The primary text color for the current theme, i.e. white in dark theme and black in light theme.
- Transparent - Makes the color transparent so that the value mapping color shows whatever color is behind it, such as a panel background color.

Copy icon
Click the copy icon in the value mapping row that you want to copy.
Trash icon
Click the trash can icon to delete a value mapping. Once deleted, you cannot recover it.
Map a value
Create a mapping for a single value.
- Open the panel editor.
- In the Value mappings section of the side pane, click Add value mappings.
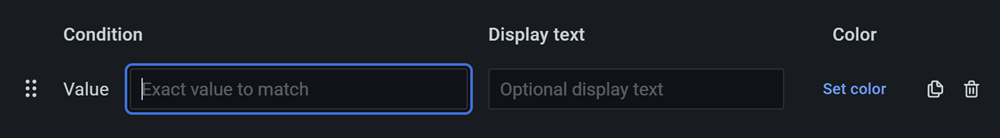
- Click Add a new mapping and then select Value.
- Enter the exact value for Grafana to match.
- (Optional) Enter display text.
- (Optional) Set the color.
- Click Update to save the value mapping.
Map a range
Create a mapping for a range of values.
- Open the panel editor.
- In the Value mappings section of the side pane, click Add value mappings.
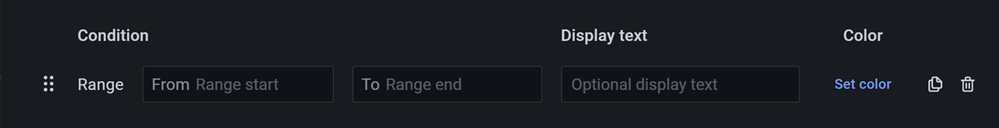
- Click Add a new mapping and then select Range.
- Enter the beginning and ending values in the range for Grafana to match.
- (Optional) Enter display text.
- (Optional) Set the color.
- Click Update to save the value mapping.
Map a special value
Create a mapping for a special value.

- Open the panel editor.
- In the Value mappings section of the side pane, click Add value mappings.
- Click Add a new mapping and then select Special.
- Select the special value for Grafana to match. Options include:
- Null
- NaN (Not a Number)
- Null + NaN
- True
- False
- Empty
- (Optional) Enter display text.
- (Optional) Set the color.
- Click Update to save the value mapping.
Edit a value mapping
- Open the panel editor.
- In the Value mappings section of the side pane, click Edit value mappings.
- Make any necessary changes in the fields and then click Update.
Was this page helpful?
Related resources from Grafana Labs


