Important: This documentation is about an older version. It's relevant only to the release noted, many of the features and functions have been updated or replaced. Please view the current version.
View exemplar data
When support for exemplar support is enabled for a Prometheus data source, you can view exemplar data either in the Explore view or from the Loki log details.
In Explore
Explore visualizes exemplar traces as highlighted stars alongside metrics data. For more information on how Explore visualizes trace data, refer to Tracing in Explore.
To examine the details of an exemplar trace:
Place your cursor over an exemplar (highlighted star). Depending on your backend trace data source, you will see a blue button with the label
Query with <data source name>. In the following example, the tracing data source is Tempo.![Screenshot showing Exemplar details Screenshot showing Exemplar details]()
Screenshot showing Exemplar details Click the Query with Tempo option next to the
traceIDproperty. The trace details, including the spans within the trace are listed in a separate panel on the right.![Explorer view with panel showing trace details Explorer view with panel showing trace details]()
Explorer view with panel showing trace details
For more information on how to drill down and analyze the trace and span details, refer to the Analyze trace and span details section.
In logs
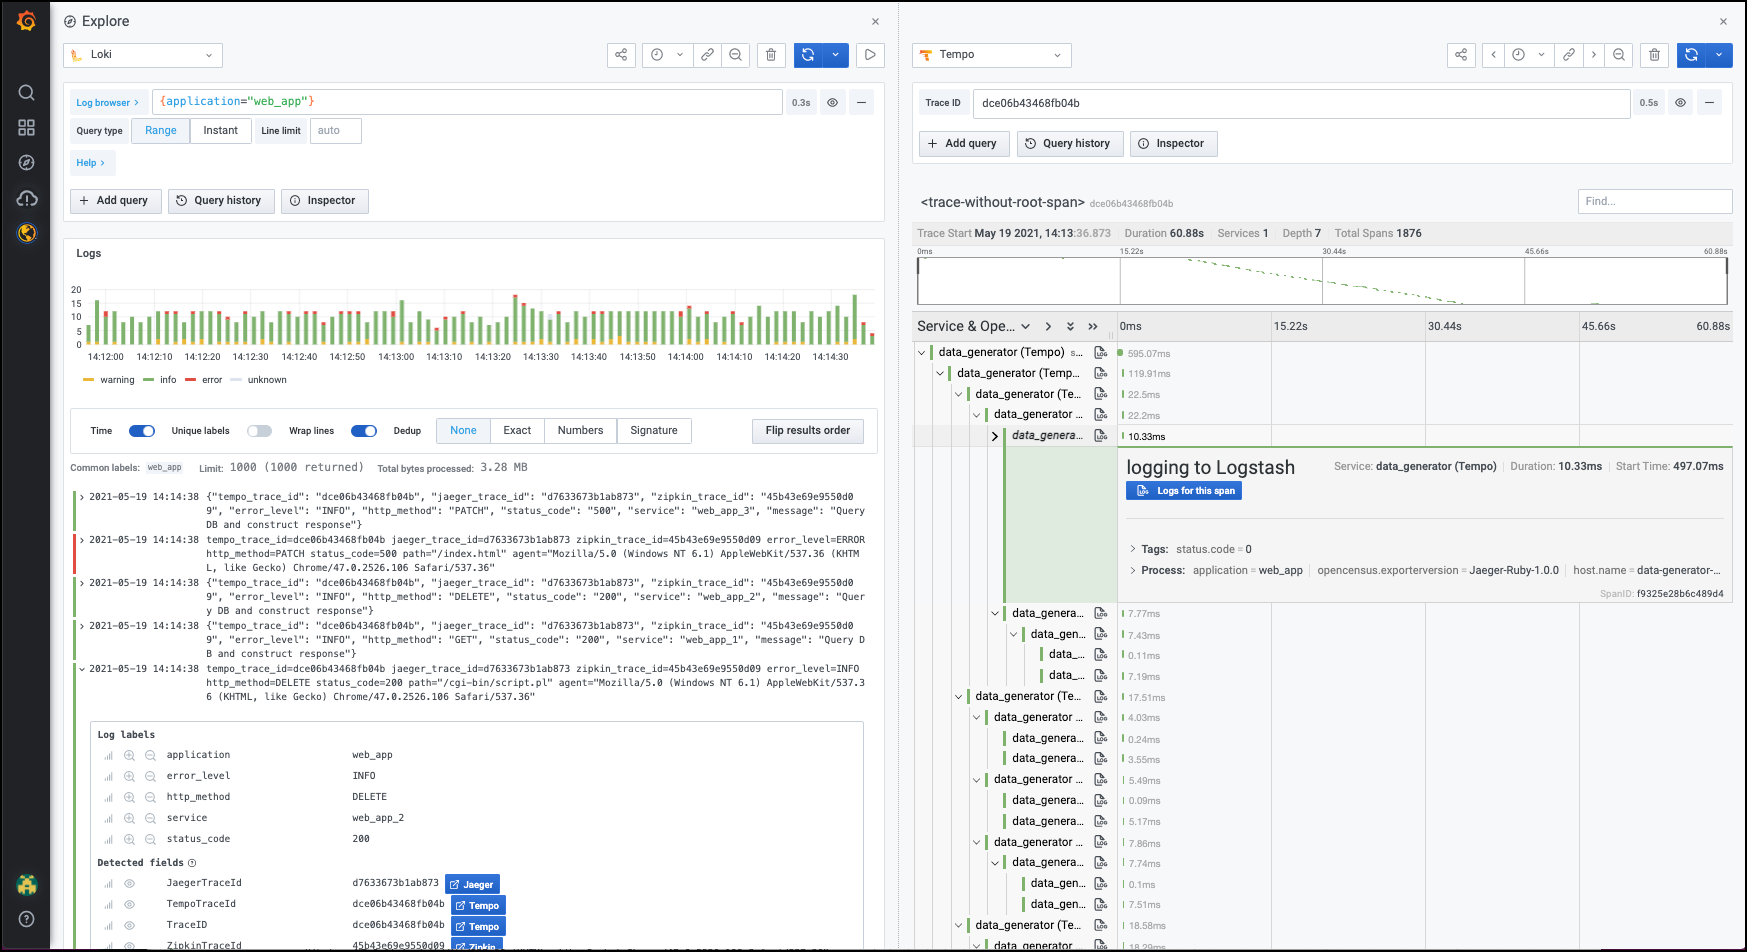
You can also view exemplar trace details from the Loki logs in Explore. Use regex within the Derived fields links for Loki to extract the traceID information. Now when you expand Loki logs, you can see a traceID property under the Detected fields section. To learn more about how to extract a part of a log message into an internal or external link, refer to using derived fields in Loki.
To view the details of an exemplar trace:
Expand a log line and scroll down to the
Detected fieldssection. Depending on your backend trace data source, you will see a blue button with the label<data source name>.Click the blue button next to the
traceIDproperty. Typically, it will have the name of the backend data source. In the following example, the tracing data source is Tempo. The trace details, including the spans within the trace are listed in a separate panel on the right.

For more information on how to drill down and analyze the trace and span details, refer to the Analyze trace and span details section.
Analyze trace and spans
This panel shows the details of the trace in different segments.
The top segment shows the Trace ID to indicate that the query results correspond to the specific trace.
You can add more traces to the results using the
Add querybutton.The next segment shows the entire span for the specific trace as a narrow strip. All levels of the trace from the client all the way down to database query is displayed, which provides a bird’s eye view of the time distribution across all layers over which the HTTP request was processed.
You can click within this strip view to display a magnified view of a smaller time segment within the span. This magnified view shows up in the bottom segment of the panel.
In the magnified view, you can expand or collapse the various levels of the trace to drill down to the specific span of interest.
For example, if the strip view shows that most of the latency was within the app layer, you can expand the trace down the app layer to investigate the problem further. To expand a particular layer of span, click the icon on the left. The same button can collapse an expanded span.
To see the details of the span at any level, click the span itself.
This displays additional metadata associated with the span. The metadata itself is initially shown in a narrow strip but you can see more details by clicking the metadata strip.
![Span details Span details]()
Span details
Was this page helpful?
Related resources from Grafana Labs


