
Important: This documentation is about an older version. It's relevant only to the release noted, many of the features and functions have been updated or replaced. Please view the current version.
Create a Cortex or Loki managed alerting rule
Grafana allows you manage alerting rules for an external Cortex or Loki instance.
In order for both Cortex and Loki data sources to work with Grafana 8.0 alerting, enable the ruler API by configuring their respective services. Thelocal rule storage type, default for Loki, only supports viewing of rules. If you want to edit rules, then configure one of the other rule storage types. When configuring a Grafana Prometheus data source to point to Cortex, use the legacy /api/prom prefix, not /prometheus. Only single-binary mode is currently supported, and it is not possible to provide a separate URL for the ruler API.
Add or edit a Cortex or Loki managed alerting rule
- In the Grafana menu hover your cursor over the Alerting (bell) icon.
- To create a new alert rule, click New alert rule. To edit an existing rule, expand one of the rules in the Cortex / Loki section and click Edit.
- Click on the Alert type drop down and select Cortex / Loki managed alert.
- Fill out the rest of the fields. Descriptions are listed below in Alert rule fields.
- When you have finished writing your rule, click Save in the upper right corner to save the rule,, or Save and exit to save and exit rule editing.
Alert rule fields
This section describes the fields you fill out to create an alert.
Alert type
- Alert name - Enter a descriptive name. The name will be displayed in the alert rule list, as well as added as
alertnamelabel to every alert instance that is created from this rule. - Alert type - Select Cortex / Loki managed alert.
- Data source - Select a Prometheus or Loki data source. Only Prometheus data sources that support Cortex ruler API will be available.
- Namespace - Select an existing rule namespace or click Add new to create a new one.
- Group - Select an existing group within the selected namespace or click Add new to create a new one. Newly created rules will be added to the end of the rule group.

Query
Enter a PromQL or LogQL expression. Rule will fire if evaluation result has at least one series with value > 0. An alert will be created per each such series.

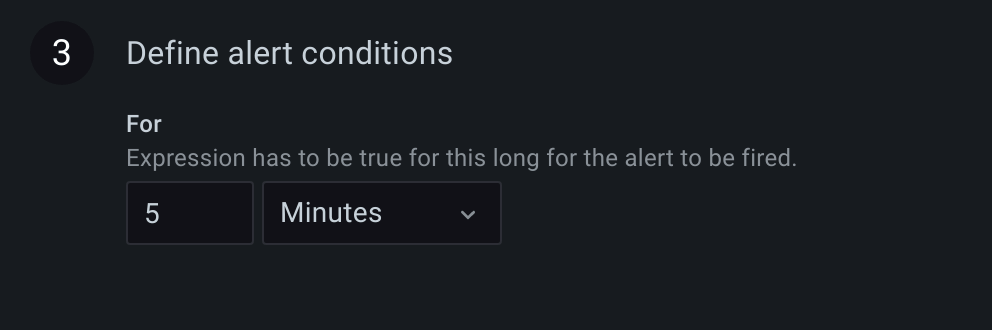
Conditions
- For - For how long the selected condition should violated before an alert enters
Firingstate. When condition threshold is violated for the first time, an alert becomesPending. If the for time elapses and the condition is still violated, it becomesFiring. Else it reverts back toNormal.
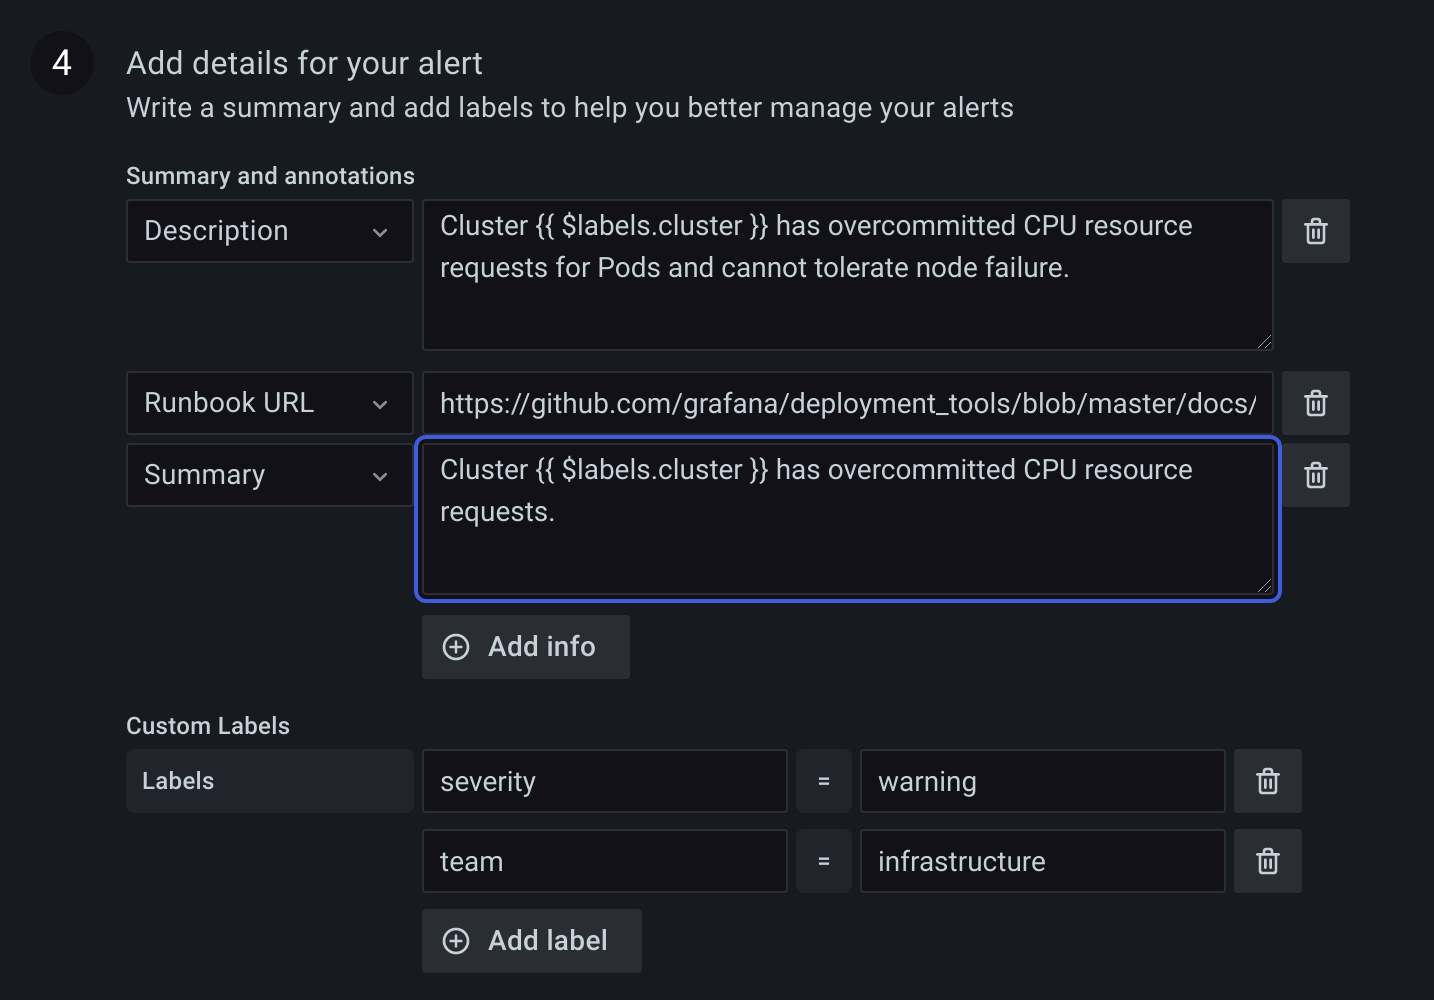
Details
Annotations and labels can be optionally added in the details section.
Annotations
Annotations are key and value pairs that provide additional meta information about the alert, for example description, summary, runbook URL. They are displayed in rule and alert details in the UI and can be used in contact type message templates. Annotations can also be templated, for example Instance {{ $labels.instance }} down will have the evaluated instance label value added for every alert this rule produces.
Labels
Labels are key value pairs that categorize or identify an alert. Labels are used to match alerts in silences or match and groups alerts in notification policies. Labels are also shown in rule or alert details in the UI and can be used in contact type message templates. For example, it is common to add a severity label and then configure a separate notification policy for each severity. Or one could add a team label and configure team specific notification policies, or silence all alerts for a particular team.
Preview alerts
To evaluate the rule and see what alerts it would produce, click Preview alerts. It will display a list of alerts with state and value of for each one.
Was this page helpful?
Related resources from Grafana Labs


