
Important: This documentation is about an older version. It's relevant only to the release noted, many of the features and functions have been updated or replaced. Please view the current version.
InfluxDB data source
InfluxDB is an open-source time series database (TSDB) developed by InfluxData. It is optimized for fast, high-availability storage and retrieval of time series data in fields such as operations monitoring, application metrics, IoT sensor data, and real-time analytics.
This topic explains options, variables, querying, and other options specific to this data source. Refer to Add a data source for instructions on how to add a data source to Grafana. Only users with the organization admin role can add data sources.
Data source options
To access data source settings, hover your mouse over the Configuration (gear) icon, then click Data sources, and then click the data source.
InfluxDB data source options differ depending on which query language you select: InfluxQL or Flux.
Note: Though not required, it’s a good practice to append the language choice to the data source name. For example:
- InfluxDB-InfluxQL
- InfluxDB-Flux
InfluxQL (classic InfluxDB query)
These options apply if you are using the InfluxQL query language. If you are using Flux, refer to Flux support in Grafana.
Flux
For information on data source settings and using Flux in Grafana, refer to Flux support in Grafana.
Min time interval
A lower limit for the auto group by time interval. Recommended to be set to write frequency, for example 1m if your data is written every minute.
This option can also be overridden/configured in a dashboard panel under data source options. It’s important to note that this value must be formatted as a number followed by a valid time identifier, e.g. 1m (1 minute) or 30s (30 seconds). The following time identifiers are supported:
Query languages
You can query InfluxDB using InfluxQL or Flux:
- InfluxQL is a SQL-like language for querying InfluxDB, with statements such as SELECT, FROM, WHERE, and GROUP BY that are familiar to SQL users. InfluxQL is available in InfluxDB 1.0 onwards.
- Flux provides significantly broader functionality than InfluxQL, supporting not only queries, but built-in functions for data shaping, string manipulation, joining to non-InfluxDB data sources and more, but also processing time-series data. It’s more similar to JavaScript with a functional style.
To help you choose the best language for your needs, here’s a comparison of Flux vs InfluxQL, and why InfluxData created Flux.
InfluxQL query editor
Enter edit mode by clicking the panel title and clicking Edit. The editor allows you to select metrics and tags.
Filter data (WHERE)
To add a tag filter, click the plus icon to the right of the WHERE condition. You can remove tag filters by clicking on the tag key and then selecting --remove tag filter--.
Regex matching
You can type in regex patterns for metric names or tag filter values. Be sure to wrap the regex pattern in forward slashes (/). Grafana automatically adjusts the filter tag condition to use the InfluxDB regex match condition operator (=~).
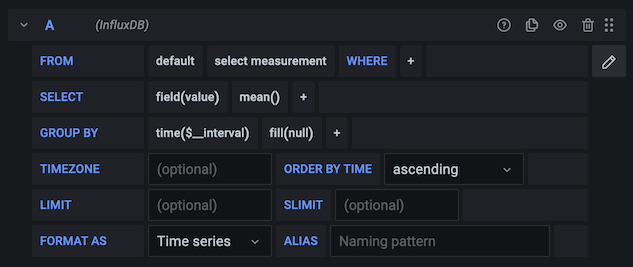
Field and Aggregation functions
In the SELECT row you can specify what fields and functions you want to use. If you have a
group by time you need an aggregation function. Some functions like derivative require an aggregation function. The editor tries to simplify and unify this part of the query. For example:
![]()
The above generates the following InfluxDB SELECT clause:
SELECT derivative(mean("value"), 10s) /10 AS "REQ/s" FROM ....Select multiple fields
Use the plus button and select Field > field to add another SELECT clause. You can also
specify an asterix * to select all fields.
Group By
To group by a tag, click the plus icon at the end of the GROUP BY row. Pick a tag from the dropdown that appears.
You can remove the “Group By” by clicking on the tag and then click on the x icon.
Text Editor Mode (RAW)
You can switch to raw query mode by clicking hamburger icon and then Switch editor mode.
If you use Raw Query be sure your query at minimum have
WHERE $timeFilter. Also, always have a group by time and an aggregation function, otherwise InfluxDB can easily return hundreds of thousands of data points that will hang the browser.
Alias patterns
- $m = replaced with measurement name
- $measurement = replaced with measurement name
- $col = replaced with column name
- $tag_exampletag = replaced with the value of the
exampletagtag. The syntax is$tag_yourTagName(must start with$tag_). To use your tag as an alias in the ALIAS BY field then the tag must be used to group by in the query. - You can also use [[tag_hostname]] pattern replacement syntax. For example, in the ALIAS BY field using this text
Host: [[tag_hostname]]would substitute in thehostnametag value for each legend value and an example legend value would be:Host: server1.
Querying logs
Querying and displaying log data from InfluxDB is available in Explore, and in the logs panel in dashboards. Select the InfluxDB data source, and then enter a query to display your logs.
Log queries
The Logs Explorer (the Measurements/Fields button) next to the query field shows a list of measurements and fields. Choose the desired measurement that contains your log data and then choose which field Explore should use to display the log message.
Once the result is returned, the log panel shows a list of log rows and a bar chart where the x-axis shows the time and the y-axis shows the frequency/count.
Filter search
To add a filter, click the plus icon to the right of the Measurements/Fields button or a condition. You can remove tag filters by clicking on the first select and choosing --remove filter--.
Annotations
Annotations allows you to overlay rich event information on top of graphs. Add annotation queries using the Annotations view in the Dashboard menu.
An example query:
SELECT title, description from events WHERE $timeFilter ORDER BY time ASCFor InfluxDB, you need to enter a query like the one in the example above. The where $timeFilter component is required. If you only select one column, then you do not need to enter anything in the column mapping fields. The Tags field can be a comma-separated string.
Was this page helpful?
Related resources from Grafana Labs


