
Important: This documentation is about an older version. It's relevant only to the release noted, many of the features and functions have been updated or replaced. Please view the current version.
Provisioning Grafana
In previous versions of Grafana, you could only use the API for provisioning data sources and dashboards. But that required the service to be running before you started creating dashboards and you also needed to set up credentials for the HTTP API. In v5.0 we decided to improve this experience by adding a new active provisioning system that uses config files. This will make GitOps more natural as data sources and dashboards can be defined via files that can be version controlled. We hope to extend this system to later add support for users, orgs and alerts as well.
Config File
Check out the configuration page for more information on what you can configure in grafana.ini
Config File Locations
- Default configuration from
$WORKING_DIR/conf/defaults.ini - Custom configuration from
$WORKING_DIR/conf/custom.ini - The custom configuration file path can be overridden using the
--configparameter
Note: If you have installed Grafana using the
deborrpmpackages, then your configuration file is located at/etc/grafana/grafana.ini. This path is specified in the Grafana init.d script using--configfile parameter.
Using Environment Variables
It is possible to use environment variable interpolation in all 3 provisioning configuration types. Allowed syntax
is either $ENV_VAR_NAME or ${ENV_VAR_NAME} and can be used only for values not for keys or bigger parts
of the configurations. It is not available in the dashboard’s definition files just the dashboard provisioning
configuration.
Example:
datasources:
  - name: Graphite
    url: http://localhost:$PORT
    user: $USER
    secureJsonData:
      password: $PASSWORD
If you have a literal $ in your value and want to avoid interpolation, $$ can be used.
Configuration Management Tools
Currently we do not provide any scripts/manifests for configuring Grafana. Rather than spending time learning and creating scripts/manifests for each tool, we think our time is better spent making Grafana easier to provision. Therefore, we heavily rely on the expertise of the community.
Data sources
This feature is available from v5.0
It’s possible to manage data sources in Grafana by adding one or more YAML config files in the provisioning/datasources directory. Each config file can contain a list of datasources that will get added or updated during start up. If the data source already exists, then Grafana updates it to match the configuration file. The config file can also contain a list of data sources that should be deleted. That list is called deleteDatasources. Grafana will delete data sources listed in deleteDatasources before inserting/updating those in the datasource list.
Running Multiple Grafana Instances
If you are running multiple instances of Grafana you might run into problems if they have different versions of the datasource.yaml configuration file. The best way to solve this problem is to add a version number to each datasource in the configuration and increase it when you update the config. Grafana will only update datasources with the same or lower version number than specified in the config. That way, old configs cannot overwrite newer configs if they restart at the same time.
Example data source Config File
# config file version
apiVersion: 1

# list of datasources that should be deleted from the database
deleteDatasources:
  - name: Graphite
    orgId: 1

# list of datasources to insert/update depending
# what's available in the database
datasources:
  # <string, required> name of the datasource. Required
  - name: Graphite
    # <string, required> datasource type. Required
    type: graphite
    # <string, required> access mode. proxy or direct (Server or Browser in the UI). Required
    access: proxy
    # <int> org id. will default to orgId 1 if not specified
    orgId: 1
    # <string> custom UID which can be used to reference this datasource in other parts of the configuration, if not specified will be generated automatically
    uid: my_unique_uid
    # <string> url
    url: http://localhost:8080
    # <string> Deprecated, use secureJsonData.password
    password:
    # <string> database user, if used
    user:
    # <string> database name, if used
    database:
    # <bool> enable/disable basic auth
    basicAuth:
    # <string> basic auth username
    basicAuthUser:
    # <string> Deprecated, use secureJsonData.basicAuthPassword
    basicAuthPassword:
    # <bool> enable/disable with credentials headers
    withCredentials:
    # <bool> mark as default datasource. Max one per org
    isDefault:
    # <map> fields that will be converted to json and stored in jsonData
    jsonData:
      graphiteVersion: '1.1'
      tlsAuth: true
      tlsAuthWithCACert: true
    # <string> json object of data that will be encrypted.
    secureJsonData:
      tlsCACert: '...'
      tlsClientCert: '...'
      tlsClientKey: '...'
      # <string> database password, if used
      password:
      # <string> basic auth password
      basicAuthPassword:
    version: 1
    # <bool> allow users to edit datasources from the UI.
    editable: false
Custom Settings per Datasource
Please refer to each datasource documentation for specific provisioning examples.
| Datasource | Misc |
|---|---|
| Elasticsearch | Elasticsearch uses the database property to configure the index for a datasource |
JSON Data
Since not all datasources have the same configuration settings we only have the most common ones as fields. The rest should be stored as a json blob in the jsonData field. Here are the most common settings that the core datasources use.
| Name | Type | Datasource | Description |
|---|---|---|---|
| tlsAuth | boolean | All | Enable TLS authentication using client cert configured in secure json data |
| tlsAuthWithCACert | boolean | All | Enable TLS authentication using CA cert |
| tlsSkipVerify | boolean | All | Controls whether a client verifies the server’s certificate chain and host name. |
| serverName | string | All | Optional. Controls the server name used for certificate common name/subject alternative name verification. Defaults to using the data source URL. |
| timeout | string | All | Request timeout in seconds. Overrides dataproxy.timeout option |
| graphiteVersion | string | Graphite | Graphite version |
| timeInterval | string | Prometheus, Elasticsearch, InfluxDB, MySQL, PostgreSQL and MSSQL | Lowest interval/step value that should be used for this data source. |
| httpMode | string | Influxdb | HTTP Method. ‘GET’, ‘POST’, defaults to GET |
| maxSeries | number | Influxdb | Max number of series/tables that Grafana processes |
| httpMethod | string | Prometheus | HTTP Method. ‘GET’, ‘POST’, defaults to POST |
| customQueryParameters | string | Prometheus | Query parameters to add, as a URL-encoded string. |
| esVersion | string | Elasticsearch | Elasticsearch version (E.g. 7.0.0, 7.6.1) |
| timeField | string | Elasticsearch | Which field that should be used as timestamp |
| interval | string | Elasticsearch | Index date time format. nil(No Pattern), ‘Hourly’, ‘Daily’, ‘Weekly’, ‘Monthly’ or ‘Yearly’ |
| logMessageField | string | Elasticsearch | Which field should be used as the log message |
| logLevelField | string | Elasticsearch | Which field should be used to indicate the priority of the log message |
| sigV4Auth | boolean | Elasticsearch and Prometheus | Enable usage of SigV4 |
| sigV4AuthType | string | Elasticsearch and Prometheus | SigV4 auth provider. default/credentials/keys |
| sigV4ExternalId | string | Elasticsearch and Prometheus | Optional SigV4 External ID |
| sigV4AssumeRoleArn | string | Elasticsearch and Prometheus | Optional SigV4 ARN role to assume |
| sigV4Region | string | Elasticsearch and Prometheus | SigV4 AWS region |
| sigV4Profile | string | Elasticsearch and Prometheus | Optional SigV4 credentials profile |
| authType | string | Cloudwatch | Auth provider. default/credentials/keys |
| externalId | string | Cloudwatch | Optional External ID |
| assumeRoleArn | string | Cloudwatch | Optional ARN role to assume |
| defaultRegion | string | Cloudwatch | Optional default AWS region |
| customMetricsNamespaces | string | Cloudwatch | Namespaces of Custom Metrics |
| profile | string | Cloudwatch | Optional credentials profile |
| tsdbVersion | string | OpenTSDB | Version |
| tsdbResolution | string | OpenTSDB | Resolution |
| sslmode | string | PostgreSQL | SSLmode. ‘disable’, ‘require’, ‘verify-ca’ or ‘verify-full’ |
| tlsConfigurationMethod | string | PostgreSQL | SSL Certificate configuration, either by ‘file-path’ or ‘file-content’ |
| sslRootCertFile | string | PostgreSQL | SSL server root certificate file, must be readable by the Grafana user |
| sslCertFile | string | PostgreSQL | SSL client certificate file, must be readable by the Grafana user |
| sslKeyFile | string | PostgreSQL | SSL client key file, must be readable by only the Grafana user |
| encrypt | string | MSSQL | Connection SSL encryption handling. ‘disable’, ‘false’ or ’true’ |
| postgresVersion | number | PostgreSQL | Postgres version as a number (903/904/905/906/1000) meaning v9.3, v9.4, …, v10 |
| timescaledb | boolean | PostgreSQL | Enable usage of TimescaleDB extension |
| maxOpenConns | number | MySQL, PostgreSQL and MSSQL | Maximum number of open connections to the database (Grafana v5.4+) |
| maxIdleConns | number | MySQL, PostgreSQL and MSSQL | Maximum number of connections in the idle connection pool (Grafana v5.4+) |
| connMaxLifetime | number | MySQL, PostgreSQL and MSSQL | Maximum amount of time in seconds a connection may be reused (Grafana v5.4+) |
Secure Json Data
{"authType":"keys","defaultRegion":"us-west-2","timeField":"@timestamp"}
Secure json data is a map of settings that will be encrypted with secret key from the Grafana config. The purpose of this is only to hide content from the users of the application. This should be used for storing TLS Cert and password that Grafana will append to the request on the server side. All of these settings are optional.
| Name | Type | Datasource | Description |
|---|---|---|---|
| tlsCACert | string | All | CA cert for out going requests |
| tlsClientCert | string | All | TLS Client cert for outgoing requests |
| tlsClientKey | string | All | TLS Client key for outgoing requests |
| password | string | All | password |
| basicAuthPassword | string | All | password for basic authentication |
| accessKey | string | Cloudwatch | Access key for connecting to Cloudwatch |
| secretKey | string | Cloudwatch | Secret key for connecting to Cloudwatch |
| sigV4AccessKey | string | Elasticsearch and Prometheus | SigV4 access key. Required when using keys auth provider |
| sigV4SecretKey | string | Elasticsearch and Prometheus | SigV4 secret key. Required when using keys auth provider |
Custom HTTP headers for datasources
Data sources managed by Grafanas provisioning can be configured to add HTTP headers to all requests
going to that datasource. The header name is configured in the jsonData field and the header value should be
configured in secureJsonData.
apiVersion: 1

datasources:
  - name: Graphite
    jsonData:
      httpHeaderName1: 'HeaderName'
      httpHeaderName2: 'Authorization'
    secureJsonData:
      httpHeaderValue1: 'HeaderValue'
      httpHeaderValue2: 'Bearer XXXXXXXXX'
Plugins
This feature is available from v7.1
You can manage plugins in Grafana by adding one or more YAML config files in the provisioning/plugins directory. Each config file can contain a list of apps that will be updated during start up. Grafana updates each app to match the configuration file.
Example plugin configuration file
apiVersion: 1

apps:
  # <string> the type of app, plugin identifier. Required
  - type: raintank-worldping-app
    # <int> Org ID. Default to 1, unless org_name is specified
    org_id: 1
    # <string> Org name. Overrides org_id unless org_id not specified
    org_name: Main Org.
    # <bool> disable the app. Default to false.
    disabled: false
    # <map> fields that will be converted to json and stored in jsonData. Custom per app.
    jsonData:
      # key/value pairs of string to object
      key: value
    # <map> fields that will be converted to json, encrypted and stored in secureJsonData. Custom per app.
    secureJsonData:
      # key/value pairs of string to string
      key: value
Dashboards
You can manage dashboards in Grafana by adding one or more YAML config files in the provisioning/dashboards directory. Each config file can contain a list of dashboards providers that load dashboards into Grafana from the local filesystem.
The dashboard provider config file looks somewhat like this:
apiVersion: 1

providers:
  # <string> an unique provider name. Required
  - name: 'a unique provider name'
    # <int> Org id. Default to 1
    orgId: 1
    # <string> name of the dashboard folder.
    folder: ''
    # <string> folder UID. will be automatically generated if not specified
    folderUid: ''
    # <string> provider type. Default to 'file'
    type: file
    # <bool> disable dashboard deletion
    disableDeletion: false
    # <int> how often Grafana will scan for changed dashboards
    updateIntervalSeconds: 10
    # <bool> allow updating provisioned dashboards from the UI
    allowUiUpdates: false
    options:
      # <string, required> path to dashboard files on disk. Required when using the 'file' type
      path: /var/lib/grafana/dashboards
      # <bool> use folder names from filesystem to create folders in Grafana
      foldersFromFilesStructure: true
When Grafana starts, it will update/insert all dashboards available in the configured path. Then later on poll that path every updateIntervalSeconds and look for updated json files and update/insert those into the database.
Note: Dashboards are provisioned to the General folder if the
folderoption is missing or empty.
Making changes to a provisioned dashboard
It’s possible to make changes to a provisioned dashboard in the Grafana UI. However, it is not possible to automatically save the changes back to the provisioning source.
If allowUiUpdates is set to true and you make changes to a provisioned dashboard, you can Save the dashboard then changes will be persisted to the Grafana database.
Note: If a provisioned dashboard is saved from the UI and then later updated from the source, the dashboard stored in the database will always be overwritten. The
versionproperty in the JSON file will not affect this, even if it is lower than the existing dashboard.If a provisioned dashboard is saved from the UI and the source is removed, the dashboard stored in the database will be deleted unless the configuration option
disableDeletionis set to true.
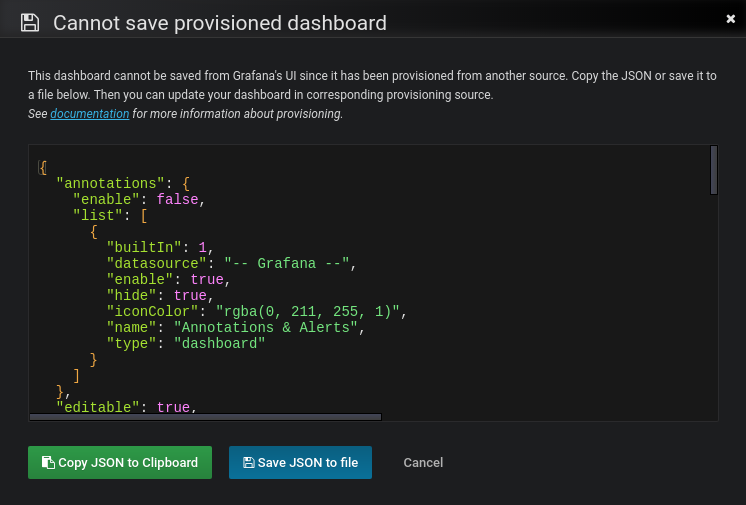
If allowUiUpdates is configured to false, you are not able to make changes to a provisioned dashboard. When you click Save, Grafana brings up a Cannot save provisioned dashboard dialog. The screenshot below illustrates this behavior.
Grafana offers options to export the JSON definition of a dashboard. Either Copy JSON to Clipboard or Save JSON to file can help you synchronize your dashboard changes back to the provisioning source.
Note: The JSON definition in the input field when using Copy JSON to Clipboard or Save JSON to file will have the id field automatically removed to aid the provisioning workflow.
Reusable Dashboard URLs
If the dashboard in the JSON file contains an UID, Grafana forces insert/update on that UID. This allows you to migrate dashboards between Grafana instances and provisioning Grafana from configuration without breaking the URLs given because the new dashboard URL uses the UID as identifier.
When Grafana starts, it updates/inserts all dashboards available in the configured folders. If you modify the file, then the dashboard is also updated.
By default, Grafana deletes dashboards in the database if the file is removed. You can disable this behavior using the disableDeletion setting.
Note: Provisioning allows you to overwrite existing dashboards which leads to problems if you re-use settings that are supposed to be unique. Be careful not to re-use the same
titlemultiple times within a folder oruidwithin the same installation as this will cause weird behaviors.
Provision folders structure from filesystem to Grafana
If you already store your dashboards using folders in a git repo or on a filesystem, and also you want to have the same folder names in the Grafana menu, you can use foldersFromFilesStructure option.
For example, to replicate these dashboards structure from the filesystem to Grafana,
/etc/dashboards
├── /server
│   ├── /common_dashboard.json
│   └── /network_dashboard.json
└── /application
    ├── /requests_dashboard.json
    └── /resources_dashboard.json
you need to specify just this short provision configuration file.
apiVersion: 1

providers:
- name: dashboards
  type: file
  updateIntervalSeconds: 30
  options:
    path: /etc/dashboards
    foldersFromFilesStructure: true
server and application will become new folders in Grafana menu.
Note:
folderandfolderUidoptions should be empty or missing to makefoldersFromFilesStructurework.
Note: To provision dashboards to the General folder, store them in the root of your
path.
Alert Notification Channels
Alert Notification Channels can be provisioned by adding one or more YAML config files in the provisioning/notifiers directory.
Each config file can contain the following top-level fields:
notifiers, a list of alert notifications that will be added or updated during start up. If the notification channel already exists, Grafana will update it to match the configuration file.delete_notifiers, a list of alert notifications to be deleted before inserting/updating those in thenotifierslist.
Provisioning looks up alert notifications by uid, and will update any existing notification with the provided uid.
By default, exporting a dashboard as JSON will use a sequential identifier to refer to alert notifications. The field uid can be optionally specified to specify a string identifier for the alert name.
{
  ...
      "alert": {
        ...,
        "conditions": [...],
        "frequency": "24h",
        "noDataState": "ok",
        "notifications": [
           {"uid": "notifier1"},
           {"uid": "notifier2"},
        ]
      }
  ...
}
Example Alert Notification Channels Config File
notifiers:
  - name: notification-channel-1
    type: slack
    uid: notifier1
    # either
    org_id: 2
    # or
    org_name: Main Org.
    is_default: true
    send_reminder: true
    frequency: 1h
    disable_resolve_message: false
    # See `Supported Settings` section for settings supported for each
    # alert notification type.
    settings:
      recipient: 'XXX'
      uploadImage: true
      token: 'xoxb' # legacy setting since Grafana v7.2 (stored non-encrypted)
      url: https://slack.com # legacy setting since Grafana v7.2 (stored non-encrypted)
    # Secure settings that will be encrypted in the database (supported since Grafana v7.2). See `Supported Settings` section for secure settings supported for each notifier.
    secure_settings:
      token: 'xoxb'
      url: https://slack.com

delete_notifiers:
  - name: notification-channel-1
    uid: notifier1
    # either
    org_id: 2
    # or
    org_name: Main Org.
  - name: notification-channel-2
    # default org_id: 1
Supported Settings
The following sections detail the supported settings and secure settings for each alert notification type. Secure settings are stored encrypted in the database and you add them to secure_settings in the YAML file instead of settings.
Note: Secure settings is supported since Grafana v7.2.
Alert notification pushover
| Name | Secure setting |
|---|---|
| apiToken | yes |
| userKey | yes |
| device | |
| priority | |
| okPriority | |
| retry | |
| expire | |
| sound | |
| okSound |
Alert notification discord
| Name | Secure setting |
|---|---|
| url | yes |
| avatar_url | |
| message |
Alert notification slack
| Name | Secure setting |
|---|---|
| url | yes |
| recipient | |
| username | |
| icon_emoji | |
| icon_url | |
| uploadImage | |
| mentionUsers | |
| mentionGroups | |
| mentionChannel | |
| token | yes |
Alert notification victorops
| Name |
|---|
| url |
| autoResolve |
Alert notification kafka
| Name |
|---|
| kafkaRestProxy |
| kafkaTopic |
Alert notification LINE
| Name | Secure setting |
|---|---|
| token | yes |
Alert notification pagerduty
| Name | Secure setting |
|---|---|
| integrationKey | yes |
| autoResolve |
Alert notification sensu
| Name | Secure setting |
|---|---|
| url | |
| source | |
| handler | |
| username | |
| password | yes |
Alert notification sensugo
| Name | Secure setting |
|---|---|
| url | |
| apikey | yes |
| entity | |
| check | |
| handler | |
| namespace |
Alert notification prometheus-alertmanager
| Name | Secure setting |
|---|---|
| url | |
| basicAuthUser | |
| basicAuthPassword | yes |
Alert notification teams
| Name |
|---|
| url |
Alert notification dingding
| Name |
|---|
| url |
Alert notification email
| Name |
|---|
| singleEmail |
| addresses |
Alert notification hipchat
| Name |
|---|
| url |
| apikey |
| roomid |
Alert notification opsgenie
| Name | Secure setting |
|---|---|
| apiKey | yes |
| apiUrl | |
| autoClose | |
| overridePriority | |
| sendTagsAs |
Alert notification telegram
| Name | Secure setting |
|---|---|
| bottoken | yes |
| chatid | |
| uploadImage |
Alert notification threema
| Name | Secure setting |
|---|---|
| gateway_id | |
| recipient_id | |
| api_secret | yes |
Alert notification webhook
| Name | Secure setting |
|---|---|
| url | |
| httpMethod | |
| username | |
| password | yes |
Alert notification googlechat
| Name |
|---|
| url |
Grafana Enterprise
Grafana Enterprise supports provisioning for the following resources:
Was this page helpful?
Related resources from Grafana Labs


