Important: This documentation is about an older version. It's relevant only to the release noted, many of the features and functions have been updated or replaced. Please view the current version.
Prometheus query editor
This topic explains querying specific to the Prometheus data source. For general documentation on querying data sources in Grafana, see Query and transform data.
Choose a query editing mode
You can switch the Prometheus query editor between two modes:
- Code mode, which provides a feature-rich editor for writing queries
- Builder mode, which provides a visual query designer

To switch between the editor modes, select the corresponding Builder and Code tabs.
To run a query, select Run queries located at the top of the editor.
Note: To run Prometheus queries in Explore, select Run query.
Each mode is synchronized with the other modes, so you can switch between them without losing your work, although there are some limitations.
Builder mode doesn’t yet support some complex queries. When you switch from Code mode to Builder mode with such a query, the editor displays a popup that explains how you might lose parts of the query if you continue. You can then decide whether you still want to switch to Builder mode.
You can also use the Explain feature to help understand how a query works, and augment queries by using template variables.
For options and functions common to all query editors, refer to Query and transform data.
Configure common options
You can configure Prometheus-specific options in the query editor by setting several options regardless of its mode.

Legend
The Legend setting defines the time series’s name. You can use a predefined or custom format.
Min step
The Min step setting defines the lower bounds on the interval between data points.
For example, set this to 1h to hint that measurements are taken hourly.
This setting supports the $__interval and $__rate_interval macros.
Format
You can switch between Table, Time series, and Heatmap options by configuring the query’s Format.
Type
The Type setting selects the query type.
A Range query returns a Range vector, comprised of a set of time series containing a range of data points over time for each time series.
An Instant query returns only the latest value that Prometheus has scraped for the requested time series. Instant queries can return results much faster than normal range queries and are well suited to look up label sets.
Instant query results are comprised of only one data point per series and can be shown in the time series panel by adding a field override, adding a property to the override named
Transform, and selectingConstantfrom the Transform dropdown.For more information, refer to the Time Series Transform option documentation.
An Exemplars query runs with the regular query and shows exemplars in the graph.
Note: Grafana modifies the request dates for queries to align them with the dynamically calculated step. This ensures a consistent display of metrics data, but it can result in a small gap of data at the right edge of a graph.
Code mode

In Code mode, you can write complex queries using a text editor with autocompletion features and syntax highlighting. It also contains a Metrics browser to further help you write queries.
For more information about Prometheus’s query language, refer to the Prometheus documentation.
Use autocompletion

Code mode’s autocompletion feature works automatically while typing.
To manually trigger autocompletion, use the keyboard shortcut
The query editor can autocomplete static functions, aggregations, and keywords, and also dynamic items like metrics and labels. The autocompletion dropdown includes documentation for the suggested items where available.
To run a query in Explore, use the keyboard shortcut
Metrics browser
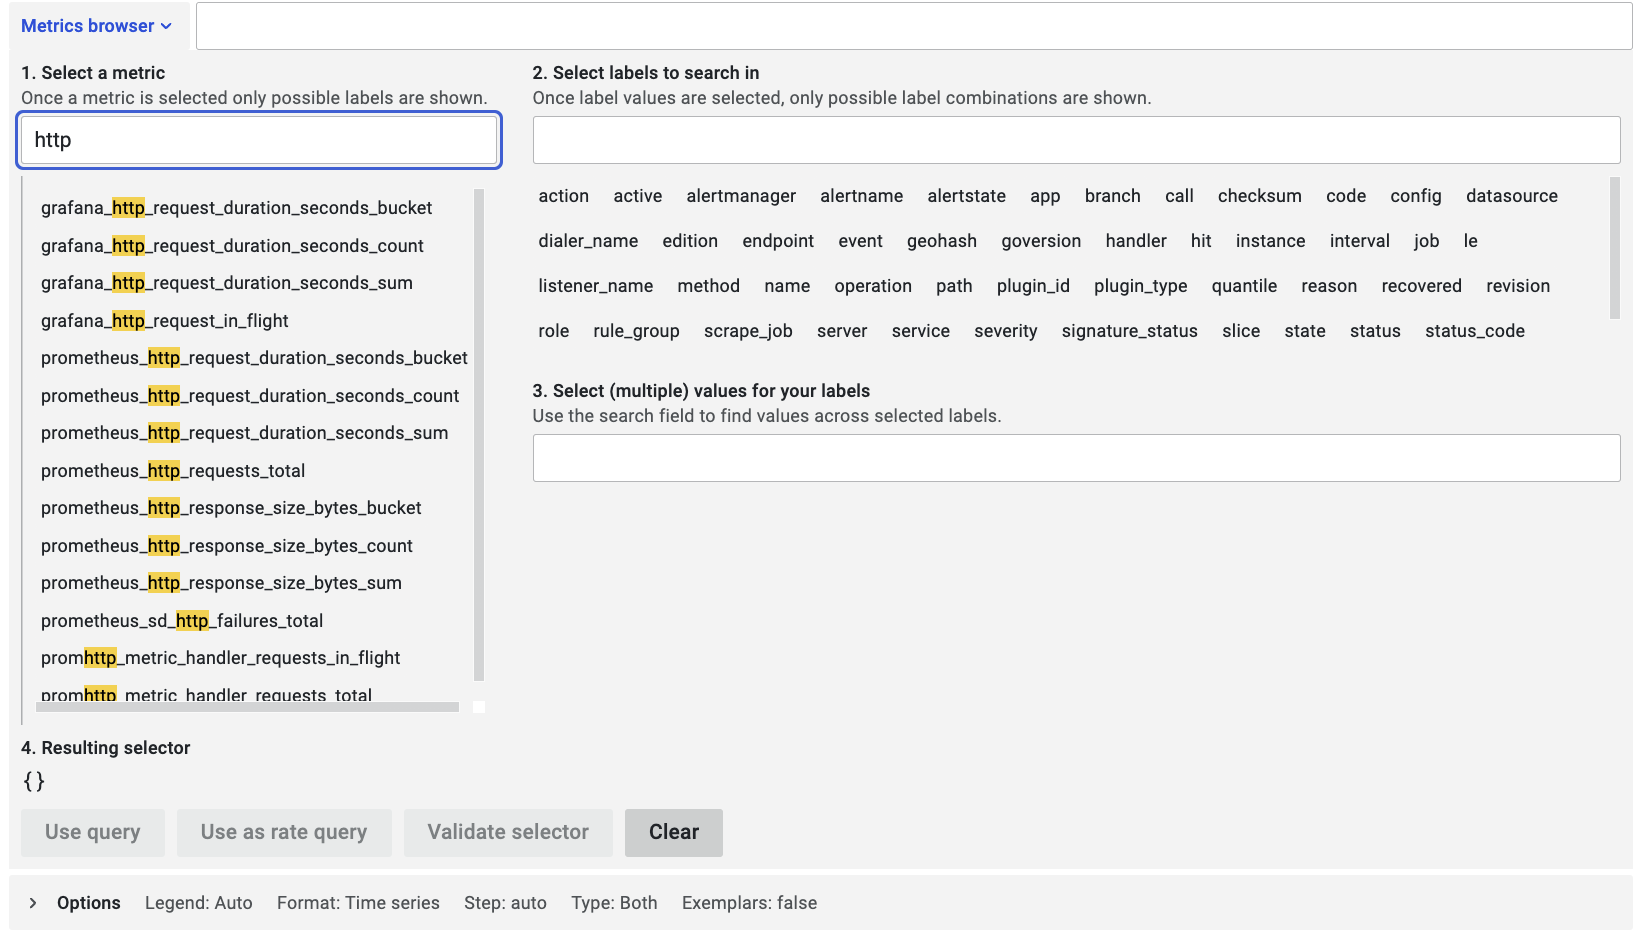
The metrics browser locates metrics and selects relevant labels to help you build basic queries. When you open the browser, it displays all available metrics and labels. If supported by your Prometheus instance, each metric also displays its HELP and TYPE as a tooltip.

When you select a metric, the browser narrows down the available labels to show only the ones applicable to the metric. You can then select one or more labels for which the available label values are shown in lists in the bottom section. Select one or more values for each label to tighten your query scope.
Note: If you do not remember a metric name to start with, you can also select a few labels to narrow down the list, then find relevant label values.
All lists in the metrics browser have a search field above them to quickly filter for metrics or labels that match a certain string. The values section has only one search field, and its filtering applies to all labels to help you find values across labels once selected.
For example, among your labels app, job, job_name only one might with the value you are looking for.
Once you are satisfied with your query, click “Use query” to run the query. The button “Use as rate query” adds a rate(...)[$__interval] around your query to help write queries for counter metrics.
The “Validate selector” button will check with Prometheus how many time series are available for that selector.
Builder mode
In Builder mode, you can build queries using a visual interface.
This video demonstrates how to use the visual Prometheus query builder available since Grafana v9.0:
There’s supposed to be a video here, but for some reason there isn’t. Either we entered the id wrong (oops!), or Vimeo is down. If it’s the latter, we’d expect they’ll be back up and running soon. In the meantime, check out our blog!
Toolbar
In addition to the Run query button and mode switcher, Builder mode includes additional elements:
Metric and labels

Select a specific metric name from the dropdown list. The data source requests the list of available metrics from the Prometheus server based on the selected time rage. You can also enter text into the selector when the dropdown is open to search and filter the list.
Select desired labels and their values from the dropdown list.
When a metric is selected, the data source requests available labels and their values from the server.
Use the + button to add a label, and the x button to remove a label.
Operations

Select the + Operations button to add operations to your query.
The query editor groups operations into related sections, and you can type while the operations dropdown is open to search and filter the list.
The query editor displays a query’s operations as boxes in the operations section. Each operation’s header displays its name, and additional action buttons appear when you hover your cursor over the header:
Some operations have additional parameters under the operation header.
For details about each operation, use the info button to view the operation’s description, or refer to the Prometheus documentation on query functions.
Some operations make sense only when used in a specific order. If adding an operation would result in nonsensical query, the query editor adds the operation to the correct place. To re-order operations manually, drag the operation box by its name and drop it into the desired place.
Hints

The query editor can detect which operations are most appropriate for some selected metrics.
If it does, it displays a hint next to the + Operations button.
To add the operations to your query, click the hint.
Use Explain mode to understand queries

Explain mode helps you understand a query by displaying a step-by-step explanation of all query components and operations.
Raw query

The query editor displays the raw query only if the Raw query switch from the query editor toolbar is enabled. If visible, it displays the raw query that the query editor has created.
Additional options
In addition to these Builder mode-specific options, the query editor also displays the options it shares in common with Code mode. For details, refer to the common options.
Apply annotations
Annotations overlay rich event information on top of graphs. You can add annotation queries in the Dashboard menu’s Annotations view.
Prometheus supports two ways to query annotations.
- A regular metric query
- A Prometheus query for pending and firing alerts (for details see Inspecting alerts during runtime)
The step option is useful to limit the number of events returned from your query.

