Important: This documentation is about an older version. It's relevant only to the release noted, many of the features and functions have been updated or replaced. Please view the current version.
TestData DB data source
Grafana ships with a TestData DB data source, which creates simulated time series data for any panel. You can use it to build your own fake and random time series data and render it in any panel, which helps you verify dashboard functionality since you can safely and easily share the data.
For instructions on how to add a data source to Grafana, refer to the administration documentation. Only users with the organization administrator role can add data sources.
Configure the data source
To access the data source configuration page:
- Hover the cursor over the Configuration (gear) icon.
- Select Data Sources.
- Select the TestData DB data source.
The data source doesn’t provide any settings beyond the most basic options common to all data sources:
| Name | Description |
|---|---|
| Name | Sets the name you use to refer to the data source in panels and queries. |
| Default | Defines whether this data source is pre-selected for new panels. |
Create mock data

Once you’ve added the TestData DB data source, your Grafana instance’s users can use it as a data source in any metric panel.
Choose a scenario
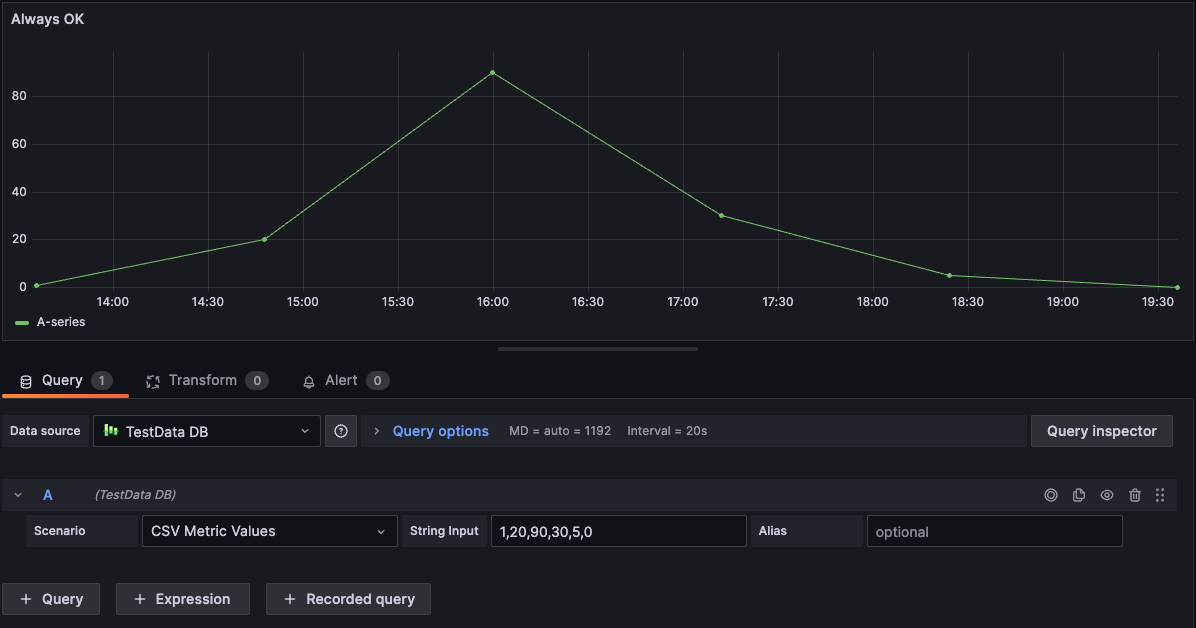
Instead of providing a query editor, the TestData DB data source helps you select a Scenario that generates simulated data for panels.
You can assign an Alias to each scenario, and many have their own options that appear when selected.

Available scenarios:
- Annotations
- Conditional Error
- CSV Content
- CSV File
- CSV Metric Values
- Datapoints Outside Range
- Exponential heatmap bucket data
- Grafana API
- Grafana Live
- Linear heatmap bucket data
- Load Apache Arrow Data
- Logs
- No Data Points
- Node Graph
- Predictable CSV Wave
- Predictable Pulse
- Random Walk
- Random Walk (with error)
- Random Walk Table
- Raw Frames
- Simulation
- Slow Query
- Streaming Client
- Table Static
- USA generated data
Import a pre-configured dashboard
TestData DB also provides an example dashboard.
To import the example dashboard:
- Navigate to the data source’s configuration page.
- Select the Dashboards tab.
- Select Import for the Simple Streaming Example dashboard.
To customize an imported dashboard:
To customize the imported dashboard, we recommend that you save it under a different name. If you don’t, upgrading Grafana can overwrite the customized dashboard with the new version.
Use test data to report issues
If you report an issue on GitHub involving the use or rendering of time series data, we strongly recommend that you use this data source to replicate the issue. That makes it much easier for the developers to replicate and solve your issue.


