
Important: This documentation is about an older version. It's relevant only to the release noted, many of the features and functions have been updated or replaced. Please view the current version.
Search dashboards
You can search for dashboards by dashboard name and by panel title. When you search for dashboards, the system returns all dashboards available within the Grafana instance, even if you do not have permission to view the contents of the dashboard.
Search dashboards using dashboard name
Begin typing any part of the dashboard name in the search bar. The search returns results for any partial string match in real-time, as you type.
Dashboard search is:
- Real-time
- Not case sensitive
- Functional across stored and file based dashboards.
Note: You can use your keyboard arrow keys to navigate the results and press
Enterto open the selected dashboard.
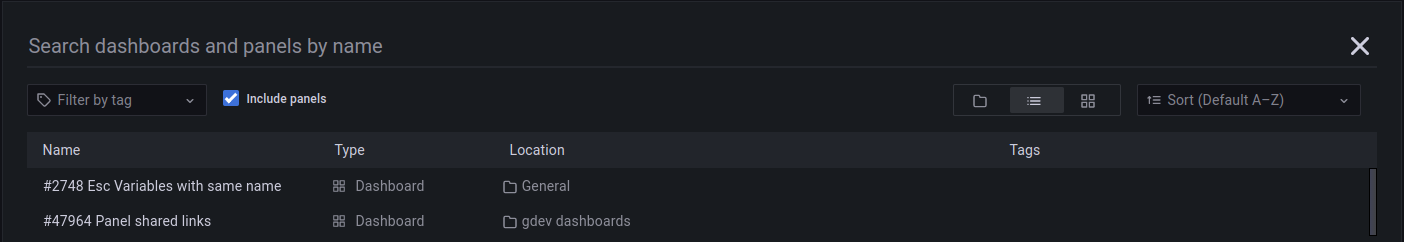
The following image shows the search results when you search using dashboard name.

Search dashboards using panel title
You can search for a dashboard by the title of a panel that appears in a dashboard. If a panel’s title matches your search query, the dashboard appears in the search results.
This feature is available by default in Grafana Cloud and in Grafana OSS v9.1 and higher, you access this feature by enabling the panelTitleSearch feature toggle.
For more information about enabling panel title search, refer to Enable the panelTitleSearch feature toggle.
The following image shows the search results when you search using panel title.
Enable the panelTitleSearch feature toggle
Complete the following steps to enable the panelTitleSearch feature toggle.
Before you begin:
- If you are running Grafana Enterprise with RBAC, enable service accounts.
To enable the panelTitleSearch feature toggle:
Open the Grafana configuration file.
Locate the feature_toggles section.
Add the following parameter to the
feature_togglessection:[feature_toggles] # enable features, separated by spaces enable = dashboardPreviewsSave your changes and restart the Grafana server.
Filter dashboard search results by tag(s)
Tags are a great way to organize your dashboards, especially as the number of dashboards grow. You can add and manage tags in dashboard Settings.
When you select multiple tags, Grafana shows dashboards that include all selected tags.
To filter dashboard search result by a tag, complete one of the following steps:
To filter dashboard search results by tag, click a tag that appears in the right column of the search results.
You can continue filtering by clicking additional tags.
To see a list of all available tags, click the Filter by tags dropdown menu and select a tag.
All tags will be shown, and when you select a tag, the dashboard search will be instantly filtered.
Note: When using only a keyboard, press the
tabkey and navigate to the Filter by tag drop-down menu, press the down arrow key▼to activate the menu and locate a tag, and pressEnterto select the tag.
Was this page helpful?
Related resources from Grafana Labs


