Important: This documentation is about an older version. It's relevant only to the release noted, many of the features and functions have been updated or replaced. Please view the current version.
Parca data source
Note: This feature is behind the
flameGraphfeature toggle. You can enable feature toggles through configuration file or environment variables. See configuration docs for details. Grafana Cloud users can access this feature by opening a support ticket in the Cloud Portal.
Grafana ships with built-in support for Parca, a continuous profiling OSS database for analysis of CPU and memory usage, down to the line number and throughout time. Add it as a data source, and you are ready to query your profiles in Explore.
Configure the Parca data source
To access Parca settings, click the Configuration (gear) icon, then click Data Sources > Parca.
Querying
Query Editor
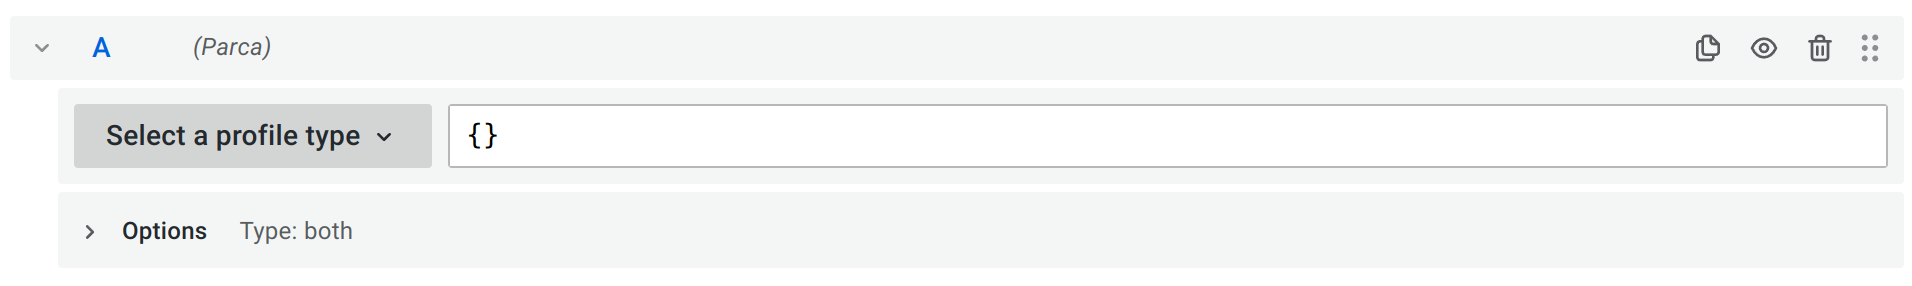
Query editor gives you access to a profile type selector, a label selector, and collapsible options.
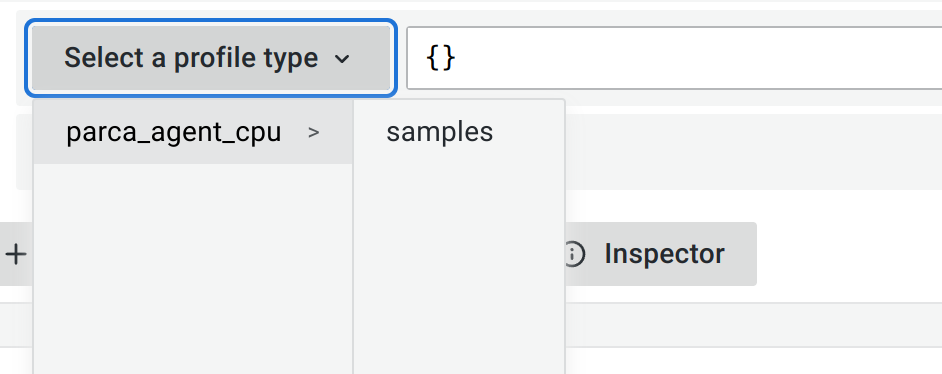
Select a profile type from the drop-down menu. While the label selector can be left empty to query all profiles without filtering by labels, the profile type must be selected for the query to be valid. Grafana does not show any data if the profile type isn’t selected when a query is run.
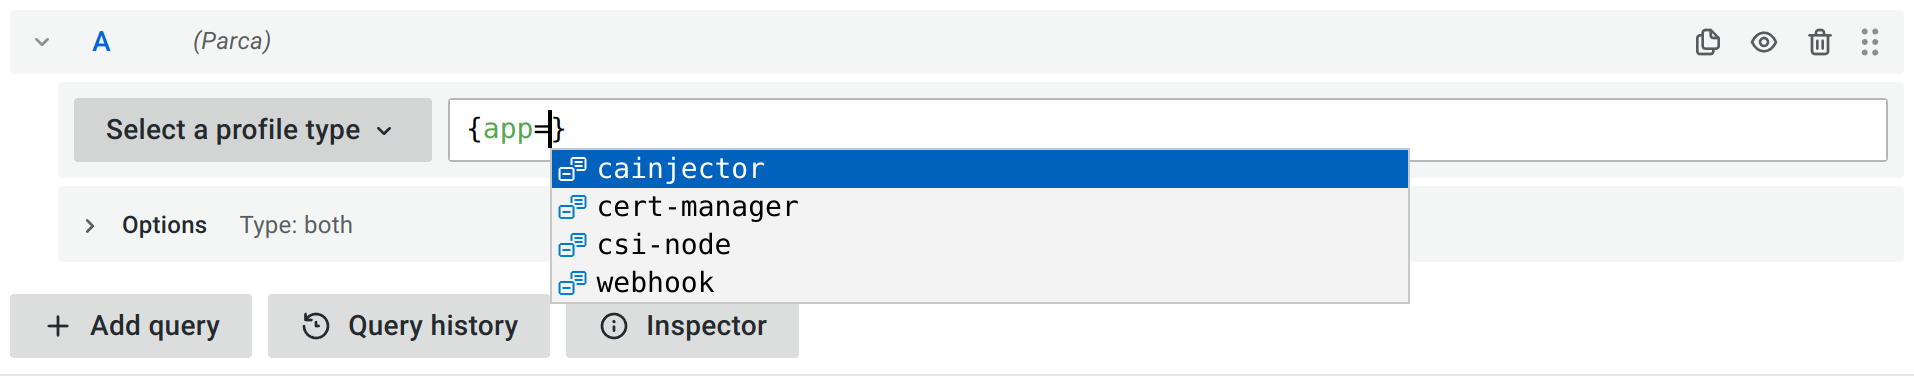
Use the labels selector input to filter by labels. Parca uses similar syntax to Prometheus to filter labels. Refer to Parca documentation for available operators and syntax.
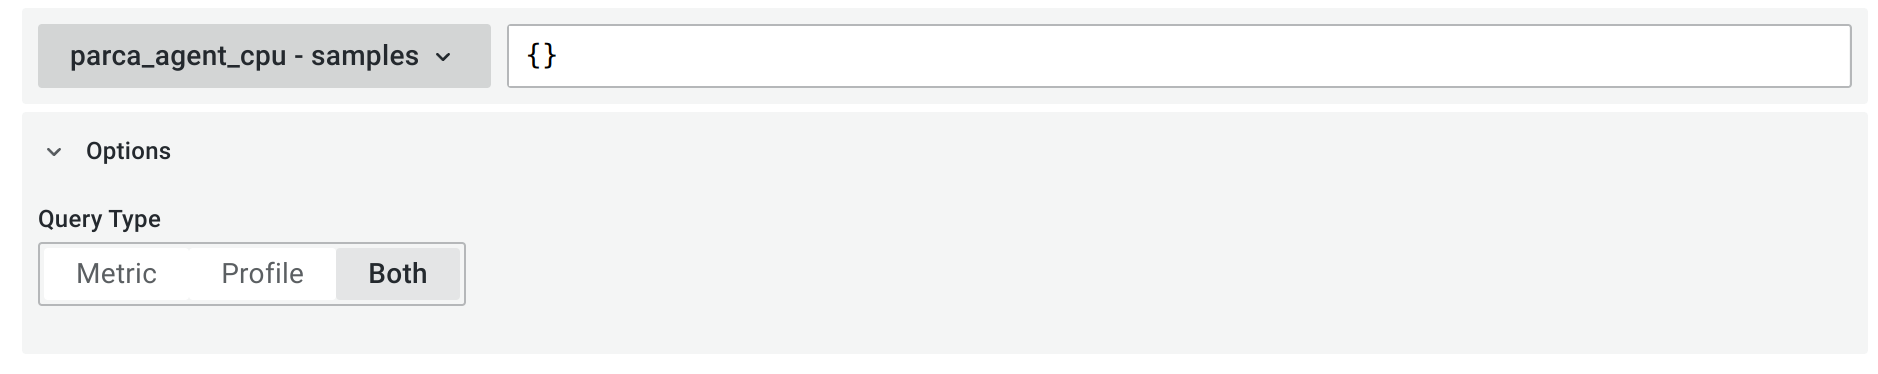
Select a query type to return the profile data which can be shown in the Flame Graph, metric data visualized in a graph, or both. You can only select both options in a dashboard, because panels allow only one visualization.
Profiles query results
Profiles can be visualized in a flame graph. See the Flame Graph documentation to learn about the visualization and its features.
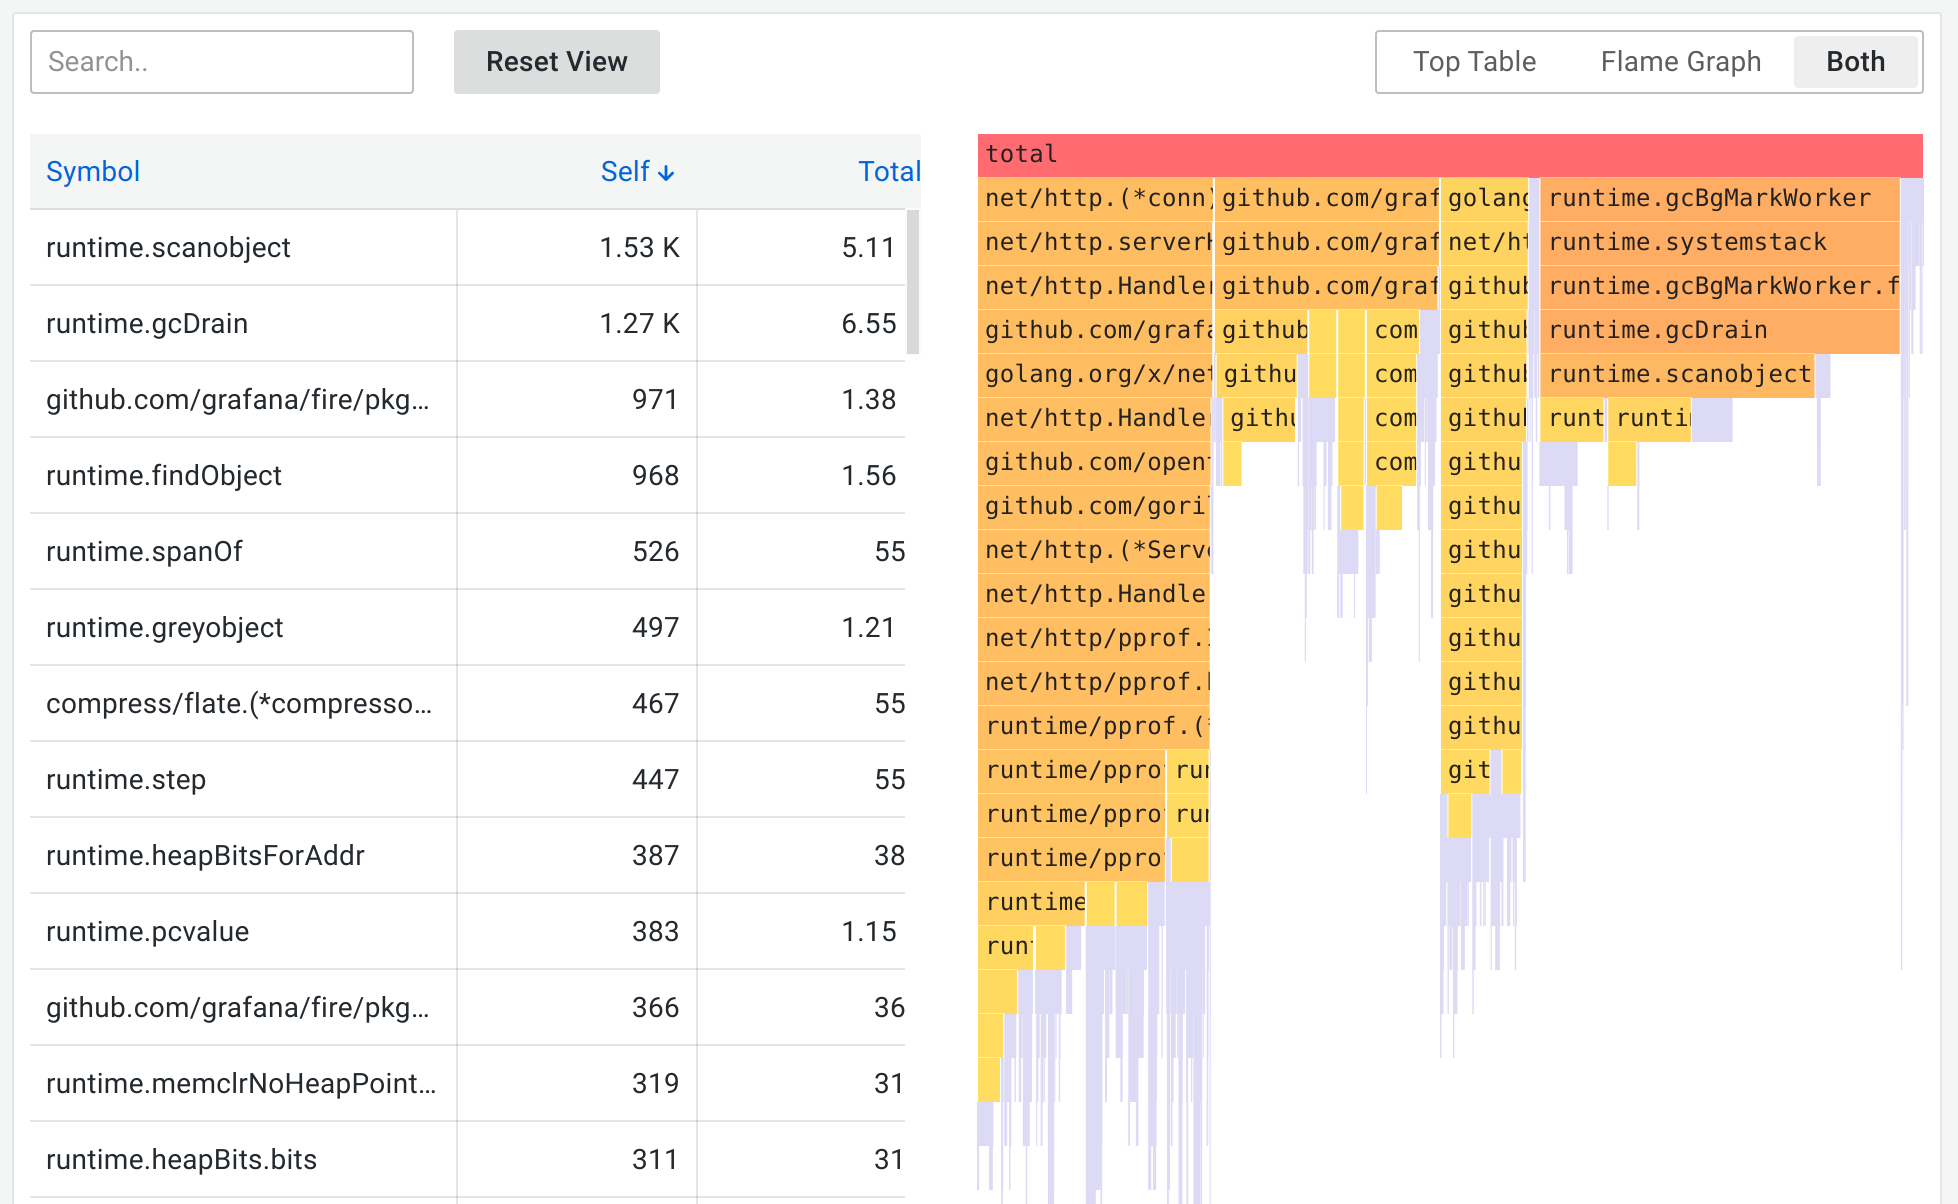
Parca returns profiles aggregated over a selected time range, and the absolute values in the flame graph grow as the time range gets bigger while keeping the relative values meaningful. You can zoom in on the time range to get a higher granularity profile up to the point of a single Parca scrape interval.
Metrics query results
Metrics results represent the aggregated value, over time, of the selected profile type. Parca returns ungrouped data with a series for each label combination.
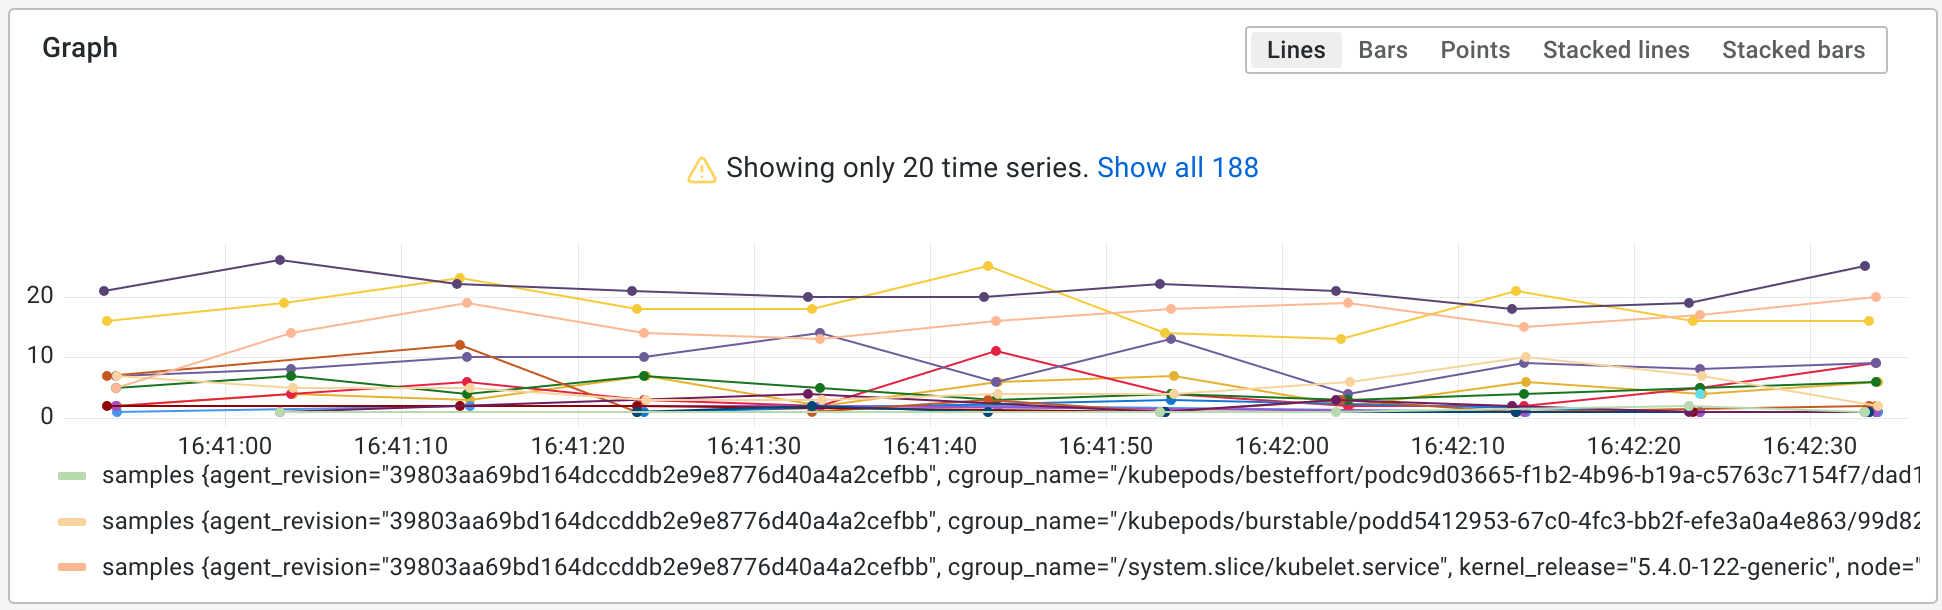
This allows you to quickly see any spikes in the value of the scraped profiles and zoom in to a particular time range.
Provision the Parca data source
You can modify the Grafana configuration files to provision the Parca data source. To learn more, and to view the available provisioning settings, see provisioning documentation.
Here is an example config:
apiVersion: 1

datasources:
  - name: Parca
    type: parca
    url: http://localhost:3100

