Important: This documentation is about an older version. It's relevant only to the release noted, many of the features and functions have been updated or replaced. Please view the current version.
Azure Monitor data source
Grafana ships with built-in support for Azure Monitor, the Azure service to maximize the availability and performance of applications and services in the Azure Cloud. This topic explains configuring and querying specific to the Azure Monitor data source.
For instructions on how to add a data source to Grafana, refer to the administration documentation. Only users with the organization administrator role can add data sources.
Once you’ve added the Azure Monitor data source, you can configure it so that your Grafana instance’s users can create queries in its query editor when they build dashboards and use Explore.
The Azure Monitor data source supports visualizing data from three Azure services:
- Azure Monitor Metrics: Collect numeric data from resources in your Azure account.
- Azure Monitor Logs: Collect log and performance data from your Azure account, and query using the Kusto Query Language (KQL).
- Azure Resource Graph: Query your Azure resources across subscriptions.
Configure the data source
To access the data source configuration page:
- Hover the cursor over the Configuration (gear) icon.
- Select Data Sources.
- Select the Azure Monitor data source.
Configure Azure Active Directory (AD) authentication
You must create an app registration and service principal in Azure AD to authenticate the data source. For configuration details, refer to the Azure documentation for service principals.
The app registration you create must have the Reader role assigned on the subscription.
For more information, refer to Azure documentation for role assignments.
If you host Grafana in Azure, such as in App Service or Azure Virtual Machines, you can configure the Azure Monitor data source to use Managed Identity for secure authentication without entering credentials into Grafana. For details, refer to Configuring using Managed Identity.
| Name | Description |
|---|---|
| Authentication | Enables Managed Identity. Selecting Managed Identity hides many of the other fields. For details, see Configuring using Managed Identity. |
| Azure Cloud | Sets the national cloud for your Azure account. For most users, this is the default “Azure”. For details, see the Azure documentation. |
| Directory (tenant) ID | Sets the directory/tenant ID for the Azure AD app registration to use for authentication. For details, see the Azure tenant and app ID docs. |
| Application (client) ID | Sets the application/client ID for the Azure AD app registration to use for authentication. |
| Client secret | Sets the application client secret for the Azure AD app registration to use for authentication. For details, see the Azure application secret docs. |
| Default subscription | (Optional) Sets a default subscription for template variables to use. |
| Default workspace | (Optional) Sets a default workspace for Log Analytics-based template variable queries to use. |
Provision the data source
You can define and configure the data source in YAML files as part of Grafana’s provisioning system. For more information about provisioning, and for available configuration options, refer to Provisioning Grafana.
Provisioning examples
Azure AD App Registration (client secret):
apiVersion: 1 # config file version

datasources:
  - name: Azure Monitor
    type: grafana-azure-monitor-datasource
    access: proxy
    jsonData:
      azureAuthType: clientsecret
      cloudName: azuremonitor # See table below
      tenantId: <tenant-id>
      clientId: <client-id>
      subscriptionId: <subscription-id> # Optional, default subscription
    secureJsonData:
      clientSecret: <client-secret>
    version: 1
Managed Identity:
apiVersion: 1 # config file version

datasources:
  - name: Azure Monitor
    type: grafana-azure-monitor-datasource
    access: proxy
    jsonData:
      azureAuthType: msi
      subscriptionId: <subscription-id> # Optional, default subscription
    version: 1
Supported cloud names
| Azure Cloud | cloudName Value |
|---|---|
| Microsoft Azure public cloud | azuremonitor (Default) |
| Microsoft Chinese national cloud | chinaazuremonitor |
| US Government cloud | govazuremonitor |
| Microsoft German national cloud (“Black Forest”) | germanyazuremonitor |
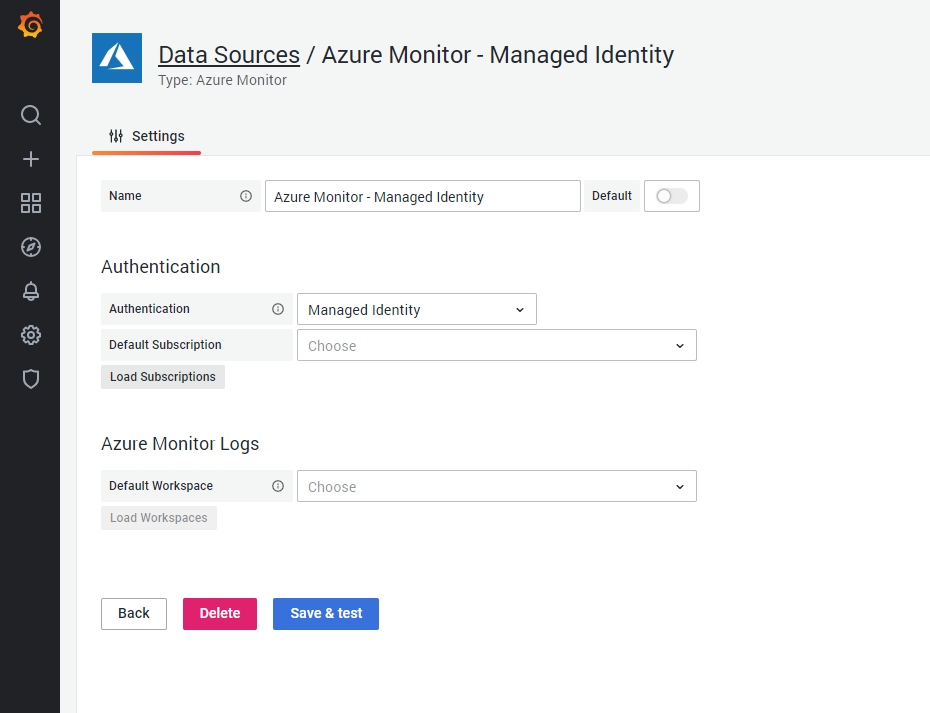
Configure Managed Identity
If you host Grafana in Azure, such as an App Service or with Azure Virtual Machines, and have managed identity enabled on your VM, you can use managed identity to configure Azure Monitor in Grafana. This lets you securely authenticate data sources without manually configuring credentials via Azure AD App Registrations for each. For details on Azure managed identities, refer to the Azure documentation.
To enable managed identity for Grafana:
Set the
managed_identity_enabledflag in the[azure]section of the Grafana server configuration.[azure] managed_identity_enabled = trueIn the Azure Monitor data source configuration, set Authentication to Managed Identity.
This hides the directory ID, application ID, and client secret fields, and the data source uses managed identity to authenticate to Azure Monitor Metrics and Logs, and Azure Resource Graph.
![Azure Monitor Metrics screenshot showing Dimensions Azure Monitor Metrics screenshot showing Dimensions]()
Azure Monitor Metrics screenshot showing Dimensions
Query the data source
The Azure Monitor data source can query data from Azure Monitor Metrics and Logs, and the Azure Resource Graph, each with its own specialized query editor.
For details, see the query editor documentation.
Use template variables
Instead of hard-coding details such as server, application, and sensor names in metric queries, you can use variables. Grafana lists these variables in dropdown select boxes at the top of the dashboard to help you change the data displayed in your dashboard. Grafana refers to such variables as template variables.
For details, see the template variables documentation.
Application Insights and Insights Analytics (removed))
Until Grafana v8.0, you could query the same Azure Application Insights data using Application Insights and Insights Analytics.
These queries were deprecated in Grafana v7.5. In Grafana v8.0, Application Insights and Insights Analytics were made read-only in favor of querying this data through Metrics and Logs. These query methods were completely removed in Grafana v9.0.
If you’re upgrading from a Grafana version prior to v9.0 and relied on Application Insights and Analytics queries, refer to the Grafana v9.0 documentation for help migrating these queries to Metrics and Logs queries.


