Important: This documentation is about an older version. It's relevant only to the release noted, many of the features and functions have been updated or replaced. Please view the current version.
Elasticsearch data source
Grafana ships with built-in support for Elasticsearch. You can make many types of queries to visualize logs or metrics stored in Elasticsearch, and annotate graphs with log events stored in Elasticsearch.
This topic explains configuring and querying specific to the Elasticsearch data source. For general documentation on querying data sources in Grafana, see Query and transform data.
For instructions on how to add a data source to Grafana, refer to the administration documentation. Only users with the organization administrator role can add data sources. Administrators can also configure the data source via YAML with Grafana’s provisioning system.
Once you’ve added the Elasticsearch data source, you can configure it so that your Grafana instance’s users can create queries in its query editor when they build dashboards and use Explore.
Supported Elasticsearch versions
This data source supports these versions of Elasticsearch:
- v7.10+
- v8.0+ (experimental)
Configure the data source
To access the data source configuration page:
- Hover the cursor over the Configuration (gear) icon.
- Select Data Sources.
- Select the Elasticsearch data source.
Set the data source’s basic configuration options carefully:
You must also configure settings specific to the Elasticsearch data source.
Index settings

Use the index settings to specify a default for the time field and your Elasticsearch index’s name.
You can use a time pattern, such as YYYY.MM.DD, or a wildcard for the index name.
Elasticsearch version
Select the version of your Elasticsearch data source from the version selection dropdown.
Different versions provide different query compositions and functionalities in the query editor.
Available Elasticsearch versions are 2.x, 5.x, 5.6+, 6.0+, 7.0+, 7.7+, and 7.10+.
Grafana assumes you’re running the lowest possible version for a specified range. This ensures that new features or breaking changes in a future Elasticsearch release don’t affect your configuration.
For example, if you run Elasticsearch 7.6.1 and select 7.0+, and a new feature is made available for Elasticsearch 7.5.0 or newer releases, then a 7.5+ option will be available.
However, your configuration won’t be affected until you explicitly select the new 7.5+ option in your settings.
Configure Min time interval
The Min time interval setting defines a lower limit for the auto group-by time interval.
This value must be formatted as a number followed by a valid time identifier:
We recommend setting this value to match your Elasticsearch write frequency.
For example, set this to 1m if Elasticsearch writes data every minute.
You can also override this setting in a dashboard panel under its data source options.
X-Pack enabled
Toggle this to enable X-Pack-specific features and options, which provide the query editor with additional aggregations, such as Rate and Top Metrics.
Include frozen indices
When the “X-Pack enabled” setting is active and the configured Elasticsearch version is higher than 6.6.0, you can configure Grafana to not ignore frozen indices when performing search requests.
Note: Frozen indices are deprecated in Elasticsearch since v7.14.
Logs
You can optionally configure the two Logs parameters Message field name and Level field name to determine which fields the data source uses for log messages and log levels when visualizing logs in Explore.
For example, if you’re using a default setup of Filebeat for shipping logs to Elasticsearch, set:
- Message field name:
message - Level field name:
fields.level
Data links
Data links create a link from a specified field that can be accessed in Explore’s logs view.
Each data link configuration consists of:
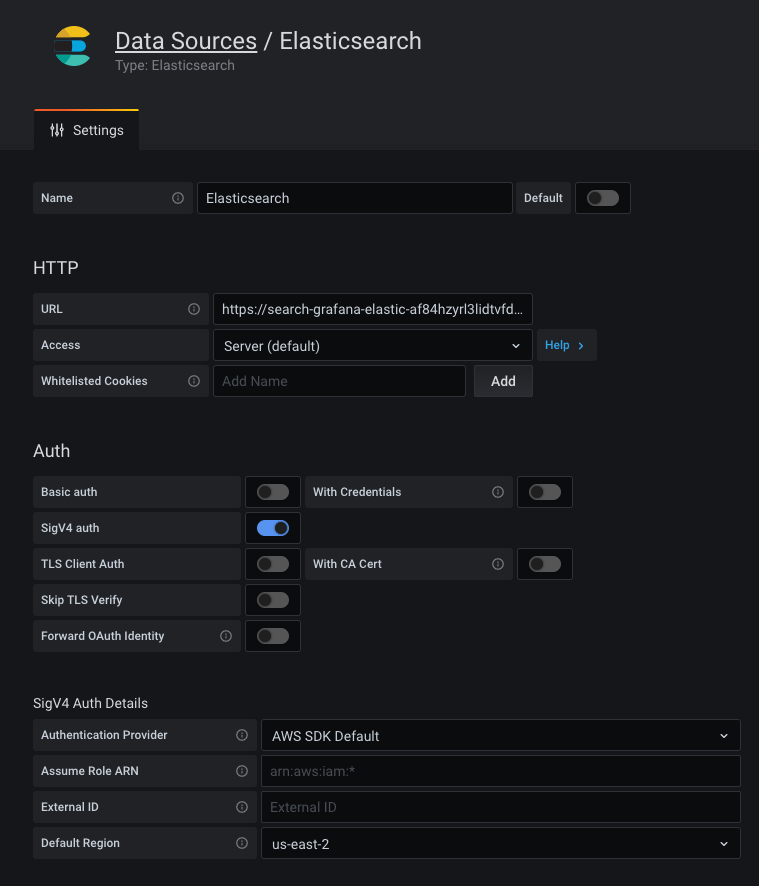
Configure Amazon Elasticsearch Service
If you use Amazon Elasticsearch Service, you can use Grafana’s Elasticsearch data source to visualize data from it.
If you use an AWS Identity and Access Management (IAM) policy to control access to your Amazon Elasticsearch Service domain, you must use AWS Signature Version 4 (AWS SigV4) to sign all requests to that domain.
For details on AWS SigV4, refer to the AWS documentation.
AWS Signature Version 4 authentication
Note: Available in Grafana v7.3 and higher.
To sign requests to your Amazon Elasticsearch Service domain, you can enable SigV4 in Grafana’s configuration.
Once AWS SigV4 is enabled, you can configure it on the Elasticsearch data source configuration page. For more information about AWS authentication options, refer to AWS authentication.

Provision the data source
You can define and configure the data source in YAML files as part of Grafana’s provisioning system. For more information about provisioning, and for available configuration options, refer to Provisioning Grafana.
Provisioning examples
Basic provisioning:
apiVersion: 1

datasources:
  - name: Elastic
    type: elasticsearch
    access: proxy
    database: '[metrics-]YYYY.MM.DD'
    url: http://localhost:9200
    jsonData:
      interval: Daily
      timeField: '@timestamp'
Provision for logs:
apiVersion: 1

datasources:
  - name: elasticsearch-v7-filebeat
    type: elasticsearch
    access: proxy
    database: '[filebeat-]YYYY.MM.DD'
    url: http://localhost:9200
    jsonData:
      interval: Daily
      timeField: '@timestamp'
      esVersion: '7.0.0'
      logMessageField: message
      logLevelField: fields.level
      dataLinks:
        - datasourceUid: my_jaeger_uid # Target UID needs to be known
          field: traceID
          url: '$${__value.raw}' # Careful about the double "$$" because of env var expansion
Query the data source
You can select multiple metrics and group by multiple terms or filters when using the Elasticsearch query editor.
For details, see the query editor documentation.
Use template variables
Instead of hard-coding details such as server, application, and sensor names in metric queries, you can use variables. Grafana lists these variables in dropdown select boxes at the top of the dashboard to help you change the data displayed in your dashboard. Grafana refers to such variables as template variables.
For details, see the template variables documentation.


