
Important: This documentation is about an older version. It's relevant only to the release noted, many of the features and functions have been updated or replaced. Please view the current version.
Create a Grafana managed alerting rule
Grafana allows you to create alerting rules that query one or more data sources, reduce or transform the results and compare them to each other or to fix thresholds. When these are executed, Grafana sends notifications to the contact point. For information on Grafana Alerting, see About Grafana Alerting which explains the various components of Grafana Alerting. We also recommend that you familiarize yourself with some of the fundamental concepts of Grafana Alerting.
Watch this video to learn more about creating alerts:
There’s supposed to be a video here, but for some reason there isn’t. Either we entered the id wrong (oops!), or Vimeo is down. If it’s the latter, we’d expect they’ll be back up and running soon. In the meantime, check out our blog!
Add Grafana managed rule
- In the Grafana menu, click the Alerting (bell) icon to open the Alerting page listing existing alerts.
- Click New alert rule. The new alerting rule page opens where the Grafana managed alerts option is selected by default.
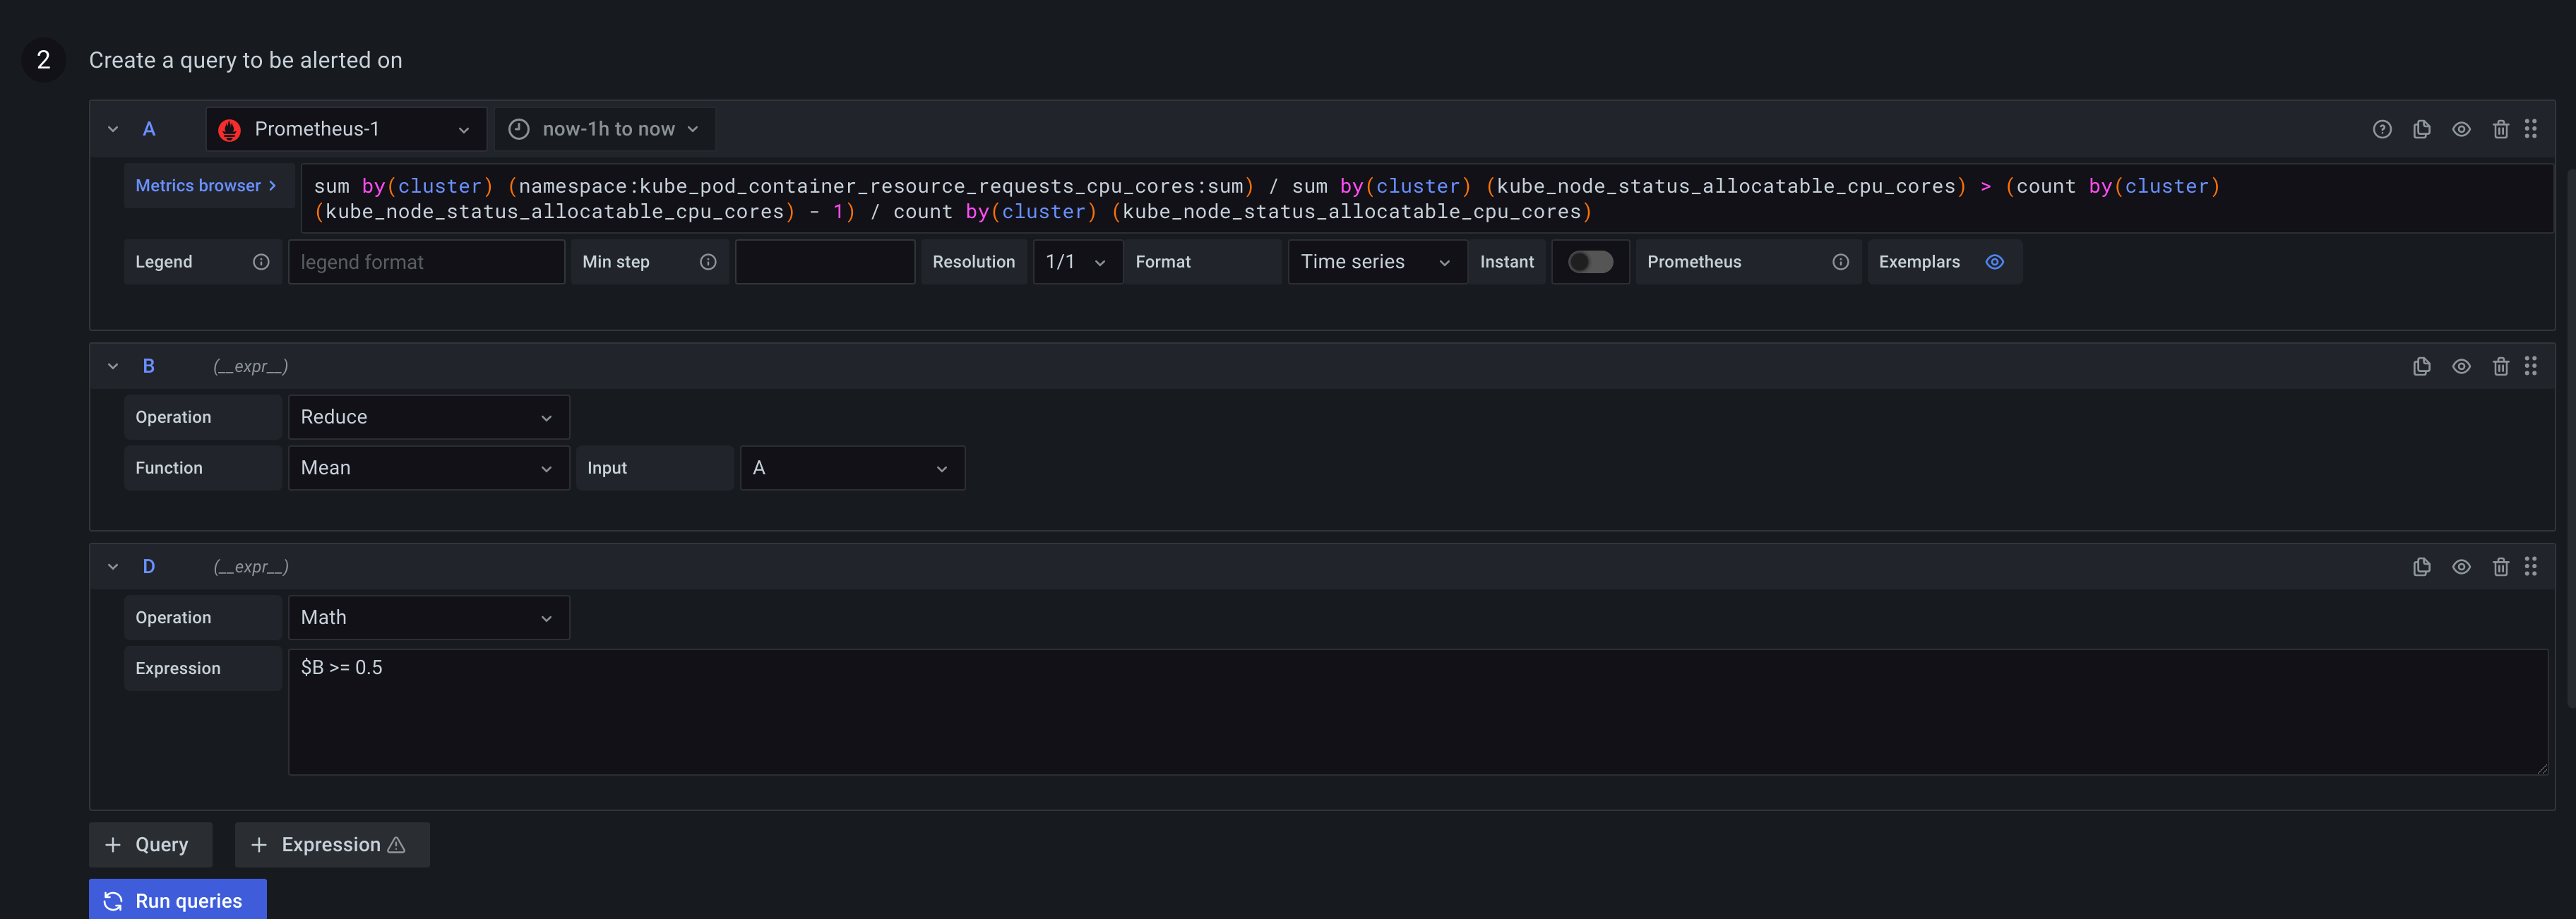
- In Step 1, add queries and expressions to evaluate, and then select the alert condition.
- For queries, select a data source from the drop-down.
- Add one or more queries or expressions.
- For each expression, select either Classic condition to create a single alert rule, or choose from Math, Reduce, Resample options to generate separate alert for each series. For details on these options, see Single and multi dimensional rule.
- Click Run queries to verify that the query is successful.
- Next, select the query or expression for your alert condition.
- In Step 2, specify the alert evaluation interval.
- From the Condition drop-down, select the query or expression to trigger the alert rule.
- For Evaluate every, specify the frequency of evaluation. Must be a multiple of 10 seconds. For examples,
1m,30s. - For Evaluate for, specify the duration for which the condition must be true before an alert fires.
Note: Once a condition is breached, the alert goes into the Pending state. If the condition remains breached for the duration specified, the alert transitions to the
Firingstate, otherwise it reverts back to theNormalstate. - In Configure no data and error handling, configure alerting behavior in the absence of data. Use the guidelines in No data and error handling.
- Click Preview alerts to check the result of running the query at this moment. Preview excludes no data and error handling.
- In Step 3, add the rule name, storage location, rule group, as well as additional metadata associated with the rule.
- In Rule name, add a descriptive name. This name is displayed in the alert rule list. It is also the
alertnamelabel for every alert instance that is created from this rule. - From the Folder drop-down, select the folder where you want to store the rule.
- For Group, specify a pre-defined group. Newly created rules are appended to the end of the group. Rules within a group are run sequentially at a regular interval, with the same evaluation time.
- Add a description and summary to customize alert messages. Use the guidelines in Annotations and labels for alerting.
- Add Runbook URL, panel, dashboard, and alert IDs.
- Add custom labels.
- In Rule name, add a descriptive name. This name is displayed in the alert rule list. It is also the
- Click Save to save the rule or Save and exit to save the rule and go back to the Alerting page.
- Next, create a for the rule.
Single and multi dimensional rule
For Grafana managed alerts, you can create a rule with a classic condition or you can create a multi-dimensional rule.
Rule with classic condition
Use the classic condition expression to create a rule that triggers a single alert when its condition is met. For a query that returns multiple series, Grafana does not track the alert state of each series. As a result, Grafana sends only a single alert even when alert conditions are met for multiple series.
Multi dimensional rule
To generate a separate alert for each series, create a multi-dimensional rule. Use Math, Reduce, or Resample expressions to create a multi-dimensional rule. For example:
- Add a
Reduceexpression for each query to aggregate values in the selected time range into a single value. (Not needed for rules using numeric data). - Add a
Mathexpression with the condition for the rule. Not needed in case a query or a reduce expression already returns 0 if rule should not fire, or a positive number if it should fire. Some examples:$B > 70if it should fire in case value of B query/expression is more than 70.$B < $C * 100in case it should fire if value of B is less than value of C multiplied by 100. If queries being compared have multiple series in their results, series from different queries are matched if they have the same labels or one is a subset of the other.
Note: Grafana does not support alert queries with template variables. More information is available at https://community.grafana.com/t/template-variables-are-not-supported-in-alert-queries-while-setting-up-alert/2514.
Rule with classic condition
For more information, see expressions documentation.
No data and error handling
Configure alerting behavior in the absence of data using information in the following tables.
| No Data Option | Description |
|---|---|
| No Data | Create a new alert DatasourceNoData with the name and UID of the alert rule, and UID of the datasource that returned no data as labels. |
| Alerting | Set alert rule state to Alerting. |
| Ok | Set alert rule state to Normal. |
| Error or timeout option | Description |
|---|---|
| Alerting | Set alert rule state to Alerting. From Grafana 8.5, the alert rule waits for the entire duration for which the condition is true before firing. |
| OK | Set alert rule state to Normal |
| Error | Create a new alert DatasourceError with the name and UID of the alert rule, and UID of the datasource that returned no data as labels. |
Was this page helpful?
Related resources from Grafana Labs


