
Important: This documentation is about an older version. It's relevant only to the release noted, many of the features and functions have been updated or replaced. Please view the current version.
Flame graph panel
Note: This panel is currently in beta & behind the
flameGraphfeature toggle.
The flame graph takes advantage of the hierarchical nature of profiling data. It condenses data into a format that allows you to easily see which code paths are consuming the most system resources.
These resources are measured through profiles which aggregate that information into a format which is then sent to the flame graph visualization. For example, allocated objects or space when measuring memory.

Figure 1 illustrates what this data looks like when rendered. The top block is the root or parent of the other blocks, and represents the total of all of the profiles being measured. There may be one or more blocks for each row that is rendered below the total. Each of these blocks represents a child in the stack of function calls that originated from the original call to the root at the top of the flame graph.
Each block can have zero or more siblings but can only have one parent.
In figure 1 displays many rows of colored blocks as well as grayed-out sections which are a set of blocks that represent a relatively short execution time and were collapsed together into one section for performance reasons.
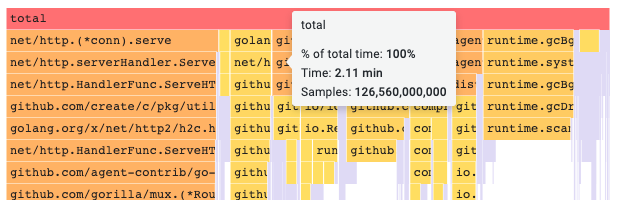
You can hover a specific block to view a tooltip that shows you what the profile is measuring, in this case total time, along with other information such as this block’s % of total time, the amount of time it took, and the samples that were measured.
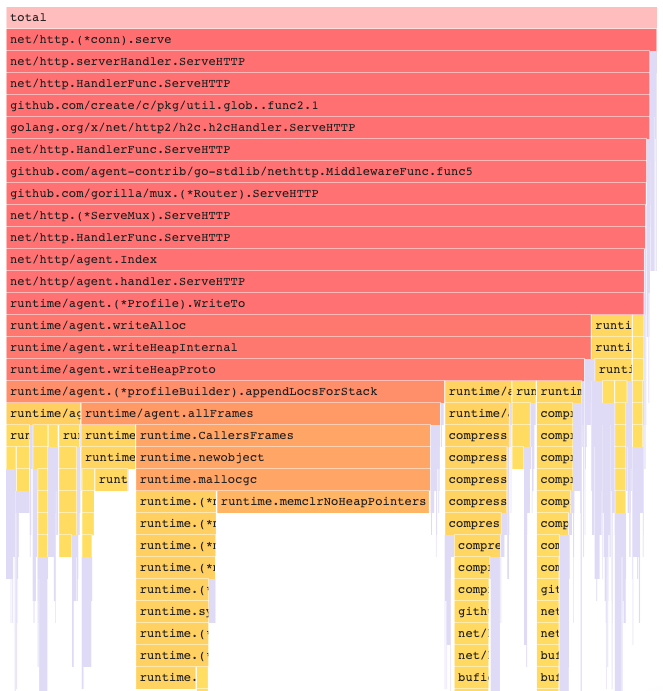
You can click on a block to drill down to the stack of function calls for that block and its child blocks. The clicked block is set to 100% of the flame graph’s width and all its children blocks are shown with their widths updated relative to the width of the parent block.
This process can be repeated to focus on finding the amount of resources that particular blocks and their children are consuming.
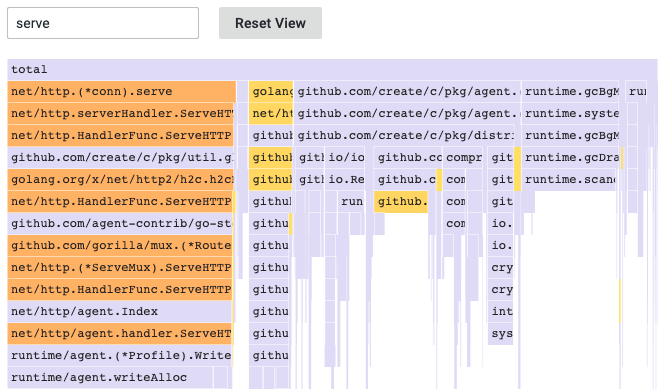
You can use the search field to find blocks with particular labels. When you search by a label name, all of the blocks in the table with labels that include the search text remain colored, while the rest of the blocks are grayed-out.
You can also click on any block or hover over it to narrow your search.
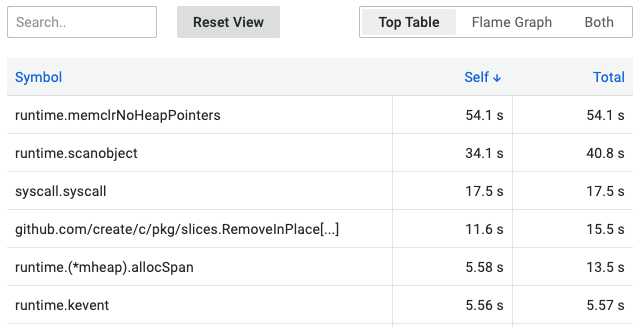
Top table
The top table allows you to visualize which symbols take up the most resources in your profile.
The table has three columns: symbols, self, and total. The table is sorted by self time by default, but can be reordered by total time or symbol name by clicking the column headers.

Clicking on a row of the top table will add or remove that row’s symbol to the search input for the flame graph.
Clicking on the same row again will remove its symbol from the search input.
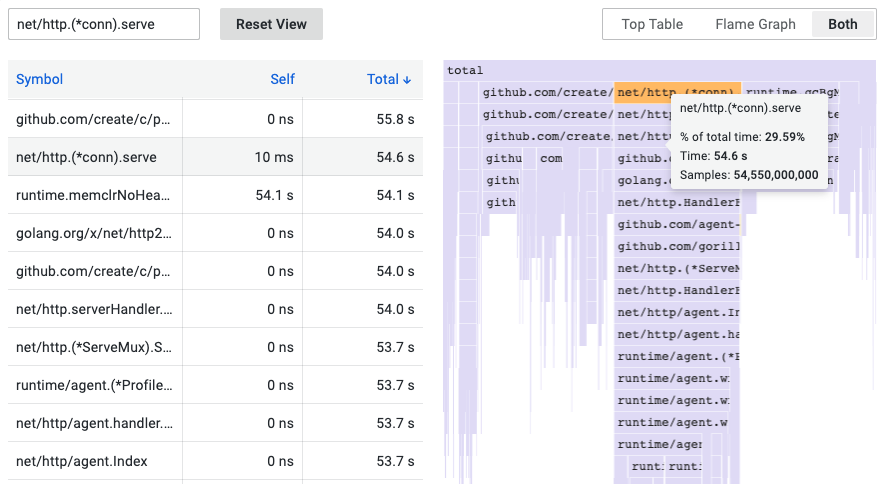
You can choose from three table view options:
- Top Table: Only show the top table
- Flame Graph: Only show the flame graph
- Both: Show both the top table and flame graph
Data API
In order to render the flame graph, you must format the data frame data using a nested set model.
A nested set model ensures each item of the flame graph is encoded just by its nesting level as an integer value, its metadata, and by its order in the data frame. This means that the order of items is significant and needs to be correct. The ordering is a depth-first traversal of the items in the flame graph which recreates the graph without needing variable-length values in the data frame like in a children’s array.
Required fields:
| Field name | Type | Description |
|---|---|---|
| level | number | The nesting level of the item. In other words how many items are between this item and the top item of the flame graph. |
| value | number | The absolute or cumulative value of the item. This translates to the width of the item in the graph. |
| label | string | Label to be shown for the particular item. |
| self | number | Self value which is usually the cumulative value of the item minus the sum of cumulative values of its immediate children. |
Was this page helpful?
Related resources from Grafana Labs


