
Plugins 〉sensu


The sensu plugin has been deprecated and is no longer maintained.
sensu
Trying to use this data source? Please contact hello@grafana.com and let us know.
Grafana App for Sensu
Requirements
- Grafana 5+
- Sensu Core 1.x
- Sensu API
Features
- Sidebar with link to premade dashboards used to manage Sensu
- Datasource for general purpose use
- Custom Panels that can be used with any dashboard (soon in v1.1)
Changes/Release Notes
See the Change Log here.
Installation
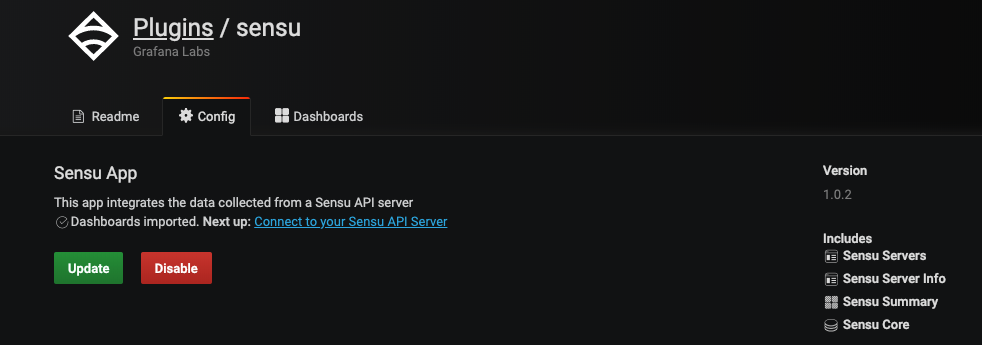
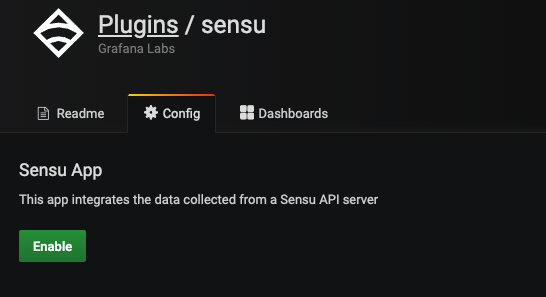
Once the plugin is installed, the application will need to be enabled:
Once enabled, you will see this:
A convenience icon is also added the side menu:

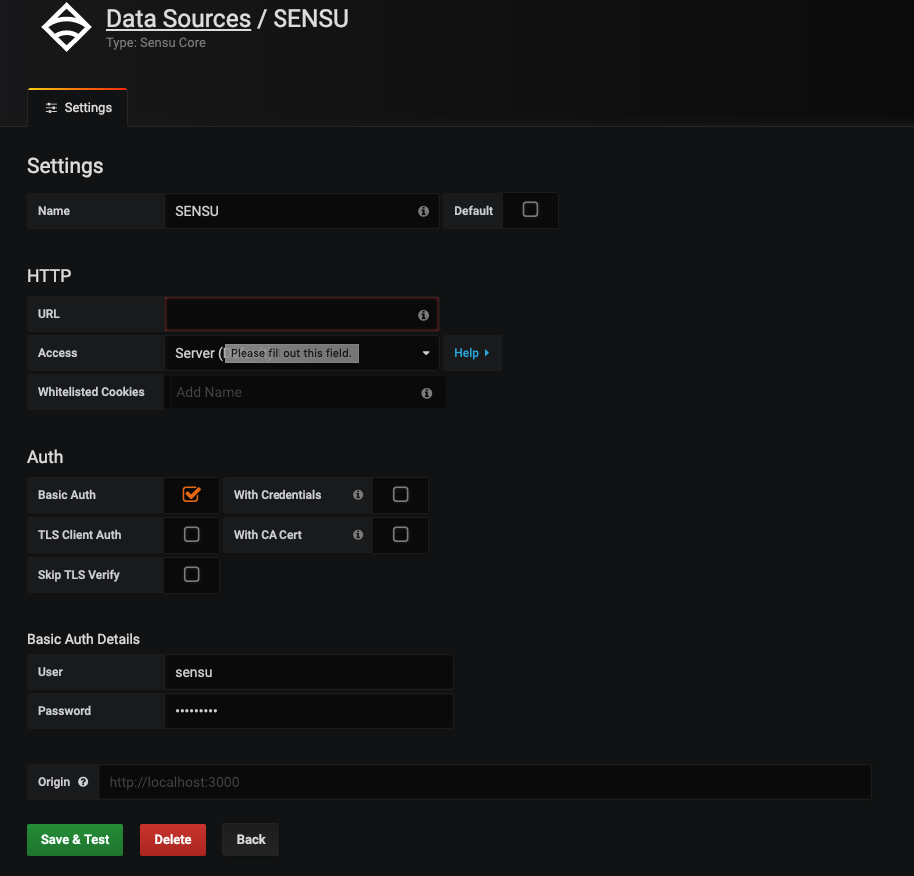
Setup datasource
The datasource needs to be configured to communicate with your Sensu API. Set the Url to your Sensu API, typically on port 4567.
NOTE: You can pre-provision the datasource before enabling the app. Once the app is enabled, the datasource will become available.
Create a file: in provisioning/datasources/sensu.yaml
# config file version
apiVersion: 1
deleteDatasources:
- name: SENSU
orgId: 1
datasources:
- name: SENSU
type: grafana-sensucore-datasource
access: proxy
url: http://sensu:4567
basicAuth: true
basicAuthUser: sensu
basicAuthPassword: mypassword
withCredentials: false
isDefault: false
jsonData:
tlsAuth: false
tlsAuthWithCACert: false
secureJsonData:
tlsCACert: ""
tlsClientCert: ""
tlsClientKey: ""
version: 1
editable: true
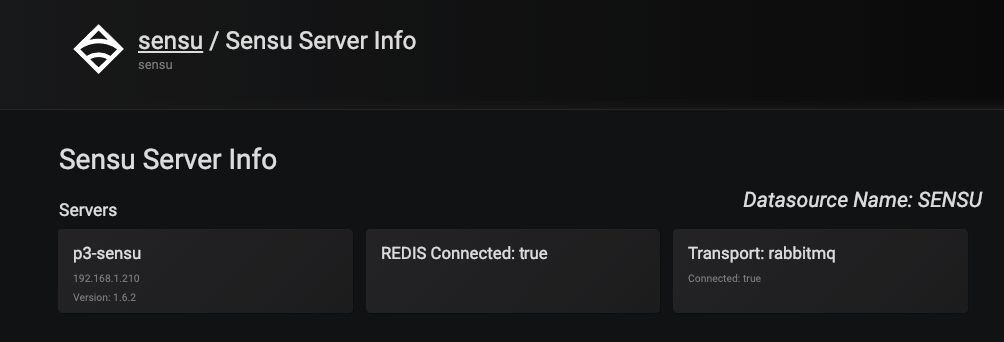
Sensu API detail
Once a datasource is created, you can see select the name of the instance, and see details about the API.
Authentication
Basic Auth and Basic Auth over SSL have been tested.
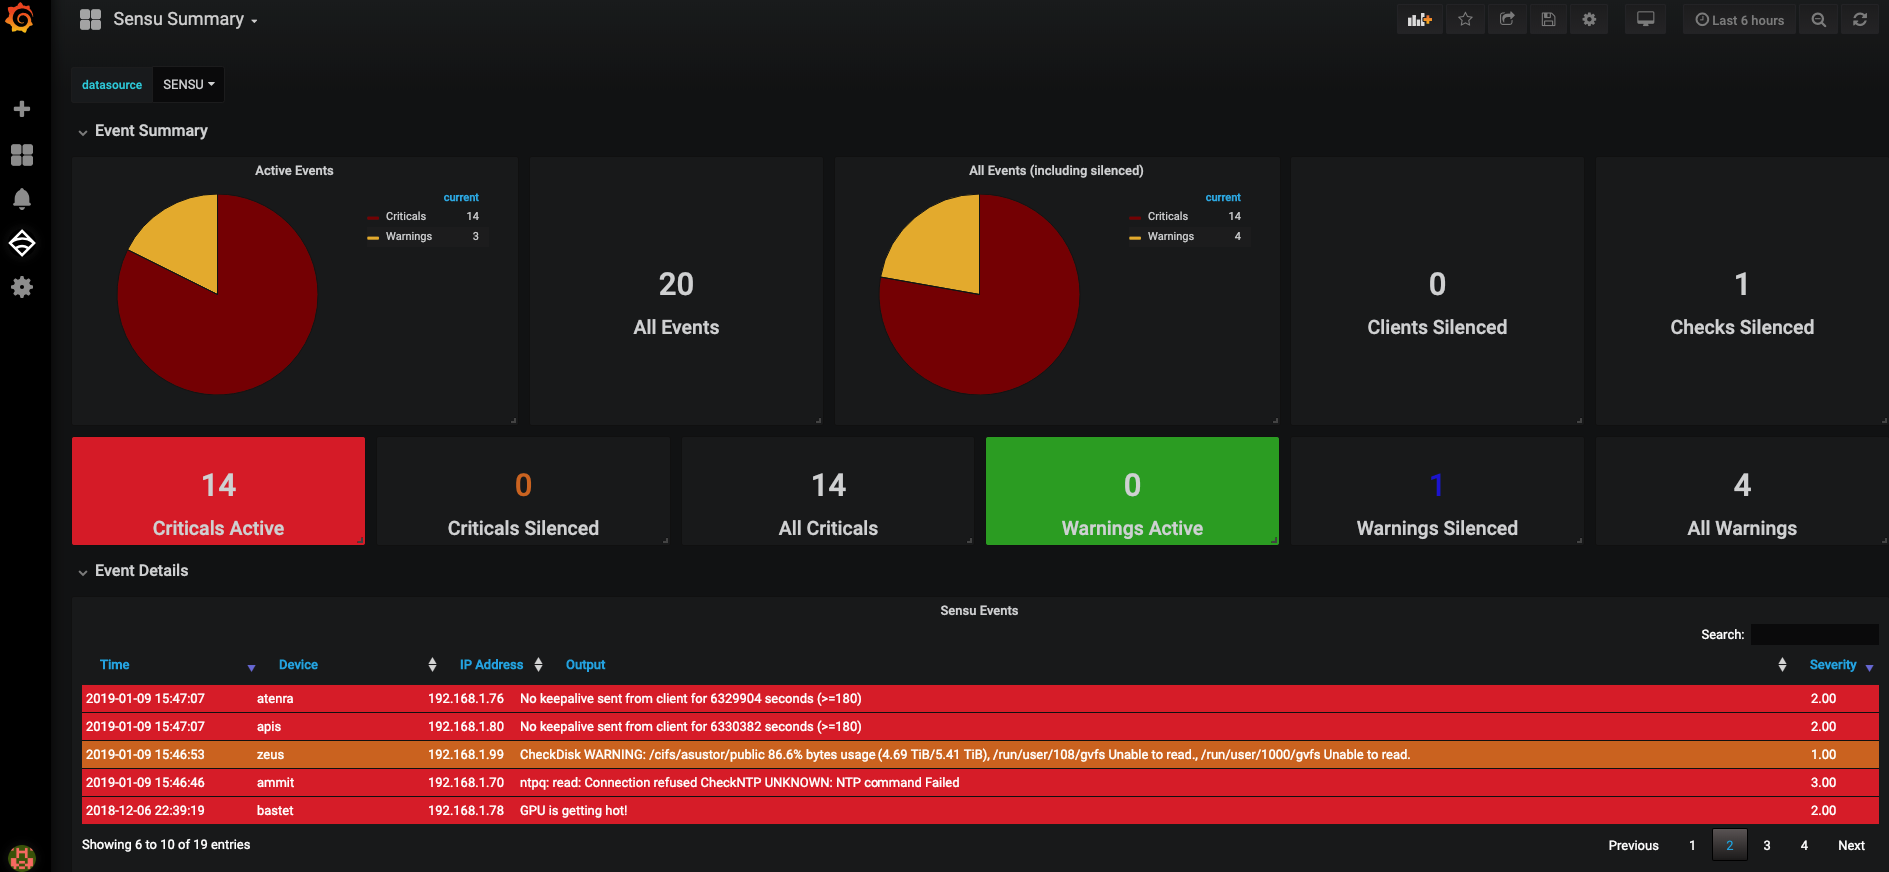
Summary Dashboard
A dashboard is included to give you a quick view of your Sensu environment.
NOTE: If the import fails while enabling, you can re-import it using the plugin configuration page:

Using the datasource
The datasource interacts with your Sensu API, and is intended to provide "read-only" actions through the query interface. Additional (write) functionality will be provided through custom panels.
The datasource can be used to fetch data for:
- Events (counts, by type, and details)
- Results (check results)
- Aggregates (rolled up aggregate states)
- Clients (count and list)
The query builder provides hints for each type, with two optional dimensions "Client Name" and "Check Name".
Using the query builder
ADD SCREENSHOT
There are 16 query options in the datasource:
- Aggregates: Returns aggregate check states, with 7 different "modes"
- Aggregates as JSON
- Check Subscriptions: Returns list of checks associated with a subscription
- Clients
- Clients as JSON
- Client Health as JSON
- Client History
- Events
- Events as JSON
- Event Metrics
- Event Metrics as JSON
- Results as JSON
- Results as Table
- Sensu Health
- Silenced Entries
- Stashes
Aggregates
Returns aggregate check states, with 7 "modes":
- List
- Clients
- Checks
- Results Critical
- Results OK
- Results Unknown
- Results Warning
Aggregates are best used with a Table or SingleStat panel.
List
Using the mode "List", select +Dimension and enter an aggregate name (the input field will provide hints). Once an aggregate is selected, use the Filter option to narrow the results.
- Number of checks per client
- Number of clients included in the aggregate
- State Critical
- State Warning
- State Stale
- State OK
- Total Checks in the aggregate (effectively clients * checks)
Aggregates as JSON
This source type is best used with a Table Panel. When used in a table panel the default results in a list of aggregate names.
To get more detail for an aggregate, add a dimension with name of an aggregate, then select mode "Clients". The table will now return a row per client showing all of the checks included in the aggregate.
Useful modes:
- Clients - shows clients and checks of the aggrgate
- Checks - shows check names
Check Subscriptions (not implemented)
This source type returns the list of checks associated with a subscription Dimensions
- name - name of check
- aggregate - name of aggregate
- type (metric|check)
- source - JIT client
Clients
This source type has two modes, list and count, and can be used with dimensions plus filters.
Clients as JSON
This source type returns the list of clients in json format, best used by table panels.
{"name":"zeus","address":"192.168.1.99","subscriptions":["production","linux","client:zeus"],"production_status":{"status":"production"},"version":"1.4.3","timestamp":1547076659,"datapoints":[],"type":"docs"}
Client Health as JSON (not implemented)
This source type returns the details of each check for each client.
{"timestamp":1547076646000,"check_name":"check_ntp","client":"zeus","check":{"command":"/opt/sensu/embedded/bin/check-ntp.rb","aggregates":["mining_servers"],"interval":60,"handle":false,"subscribers":["linux"],"name":"check_ntp","issued":1547076646000,"executed":1547076646000,"duration":0.074,"output":"CheckNTP OK: NTP offset by 1.002957ms
","status":0,"type":"standard","history":[0,0,0,0,0,0,0,0,0,0,0,0,0,0,0,0,0,0,0,0,0]},"last_state_change":null,"last_ok":null}
Client History
Similar to Results, but with additional data
Events
Returns events as a list with the option to filter out silenced events.
Events as JSON
Returns events in JSON format with the option to filter out silenced events. This type is best used with Table panels.
{"timestamp":1547076369000,"check_name":"keepalive","client":{"name":"pi-probe-1","address":"192.168.1.138","subscriptions":["production","linux","pi","pi-probe","client:pi-probe-1"],"production_status":{"status":"production"},"version":"1.4.2","timestamp":1540740517,"client_short_name":"pi-probe-1"},"check":{"thresholds":{"warning":120,"critical":180},"name":"keepalive","issued":1547076369000,"executed":1547076369000,"output":"No keepalive sent from client for 6335852 seconds (>=180)","status":2,"type":"standard","history":["2","2","2","2","2","2","2","2","2","2","2","2","2","2","2","2","2","2","2","2","2"],"total_state_change":0,"status_text":"CRITICAL"},"occurrences":185864,"occurrences_watermark":185864,"action":"create","id":"81fce2d2-5d89-4b21-928d-0134eba42294","last_state_change":1540799011000,"last_ok":1540740518000,"silenced":false,"silenced_by":[]}
Event Metrics
This returns totals for events depending on their state.
Event Metrics JSON
This returns json-formatted totals for events depending on their state.
{"target":"allEvents","timestamp":1547076354000,"numEvents":20,"numSilenced":1,"numClientsSilenced":10,"numChecksSilenced":10,"numWarningEvents":4,"numWarningEventsSilenced":1,"numCriticalEvents":14,"numCriticalEventsSilenced":0,"numUnknownEvents":2,"numUnknownEventsSilenced":0}
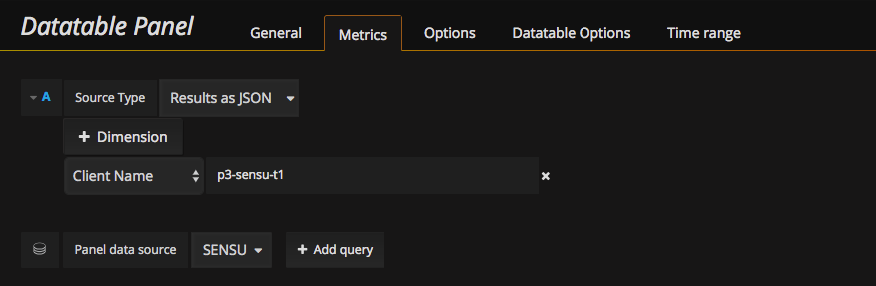
Results as JSON
Returns check results in JSON format
{"timestamp":1547076414000,"message":"check_disk_usage","client":"zeus","check":{"name":"check_disk_usage","issued":1547076414000,"executed":1547076414000,"output":"CheckDisk WARNING: /cifs/asustor/public 86.61% bytes usage (4.69 TiB/5.41 TiB), /run/user/108/gvfs Unable to read., /run/user/1000/gvfs Unable to read.
","status":1,"type":"standard"}}
Results as Table (not implemented)
Returns check results in Table format
Sensu Health (not implemented)
Silenced Entries (not implemented)
Stashes (not implemented)
Dimensions and Filters
Some query options will include dimensions and/or filters depending on which is selected.

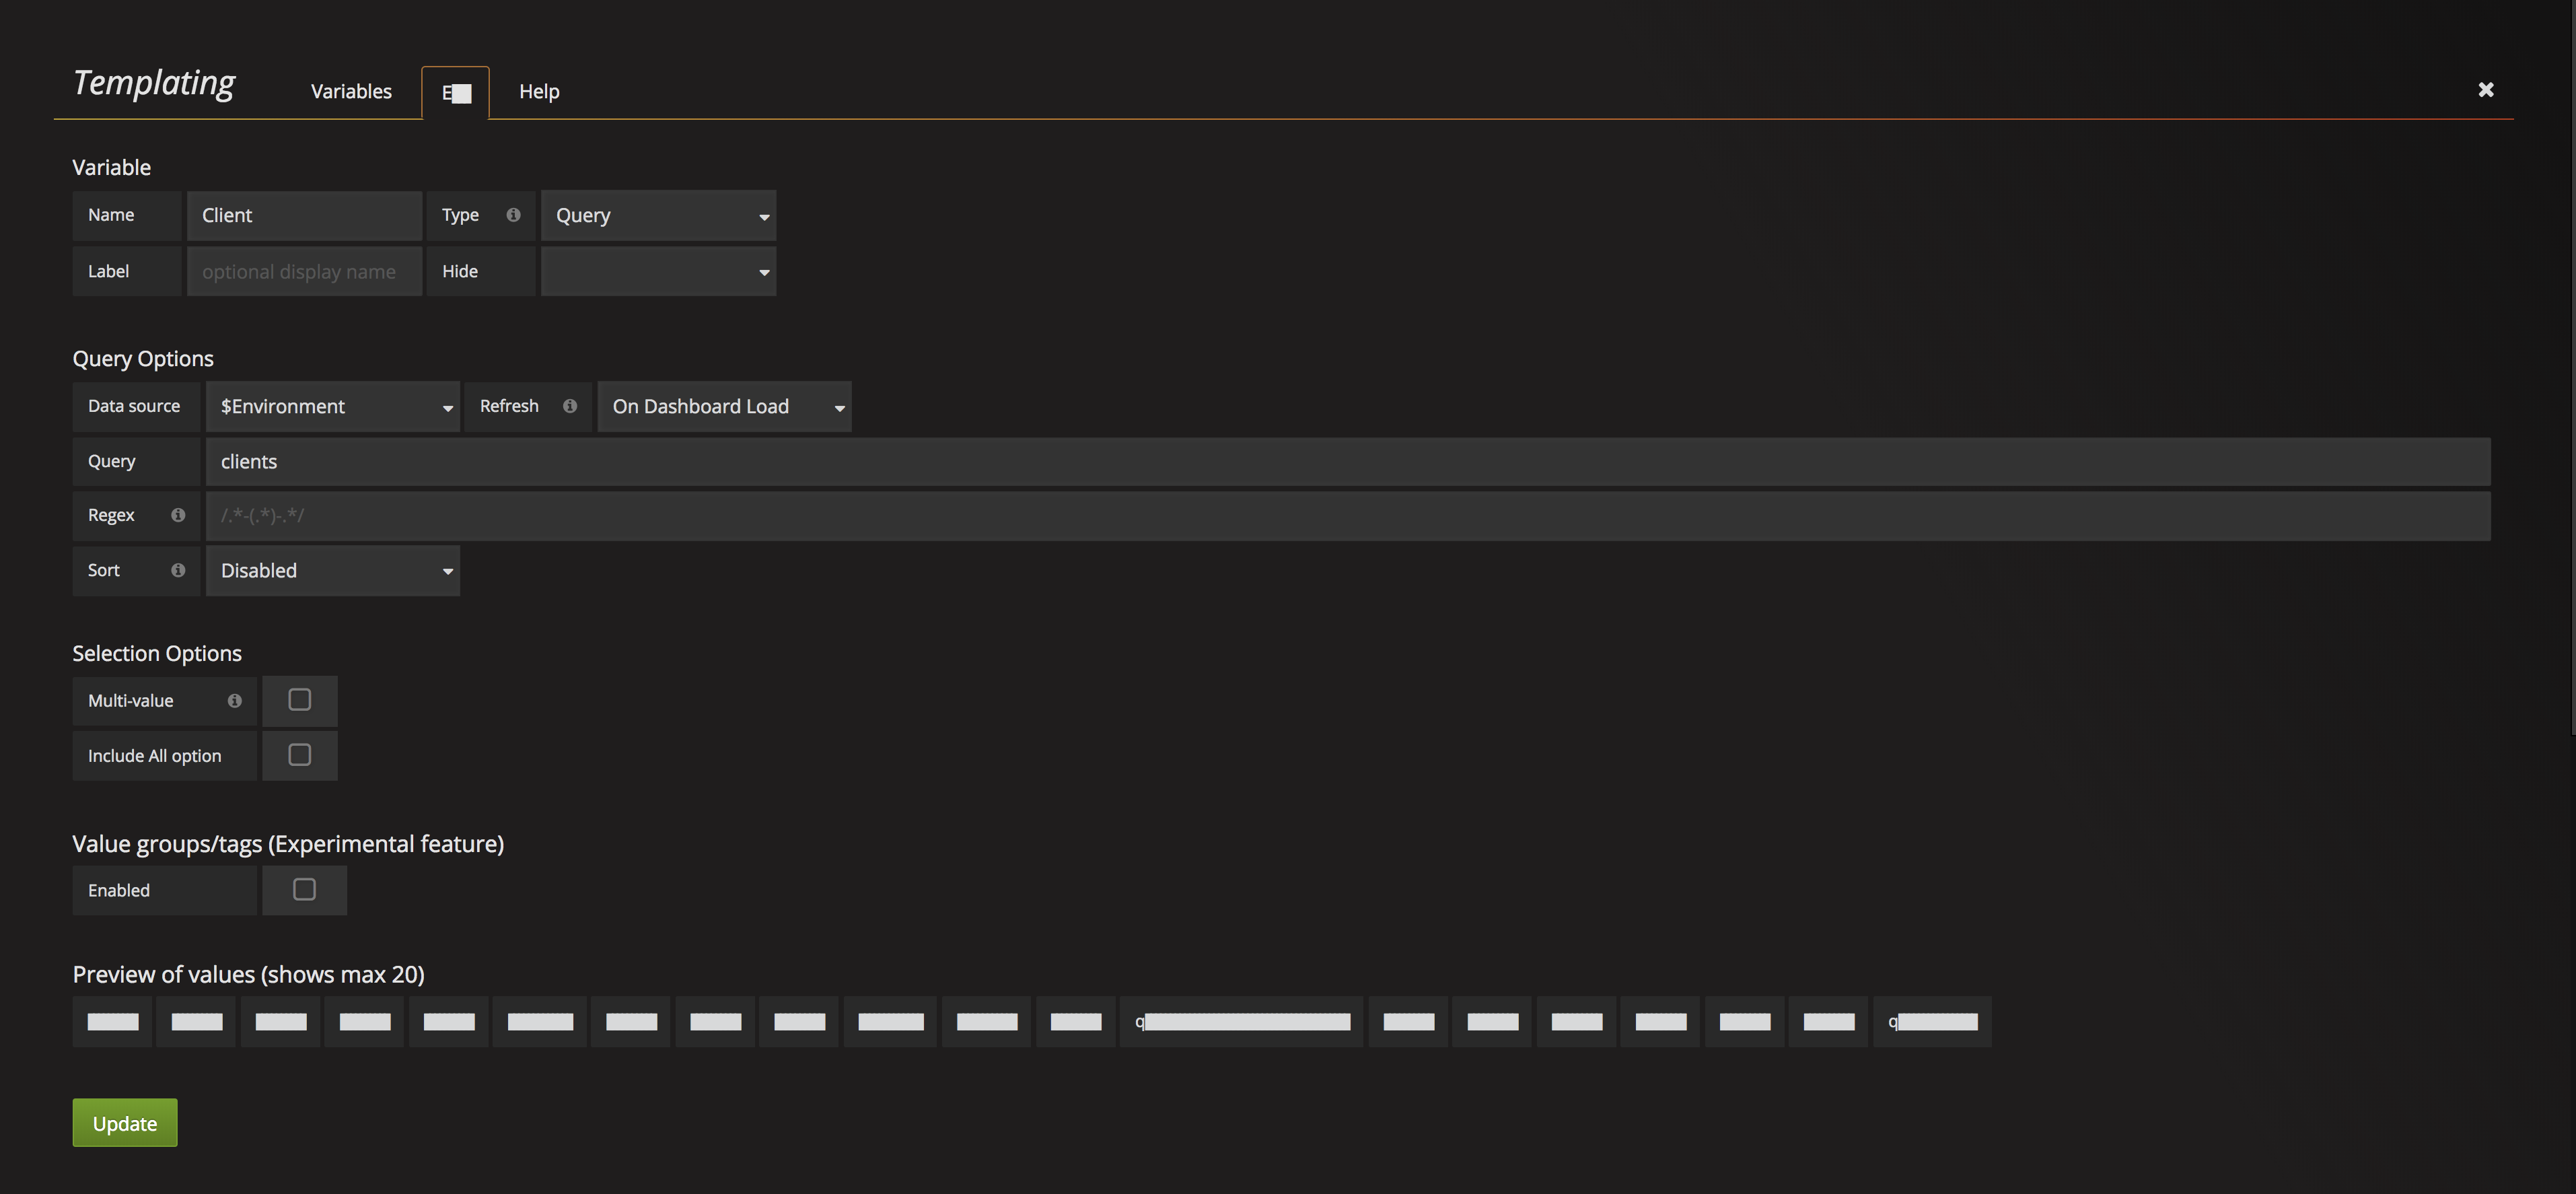
Template Variables
Support exists for using the following as template variables in Grafana:
- Clients
- Checks
- Aggregates
Here is an example configuration adding Client as a template variable:
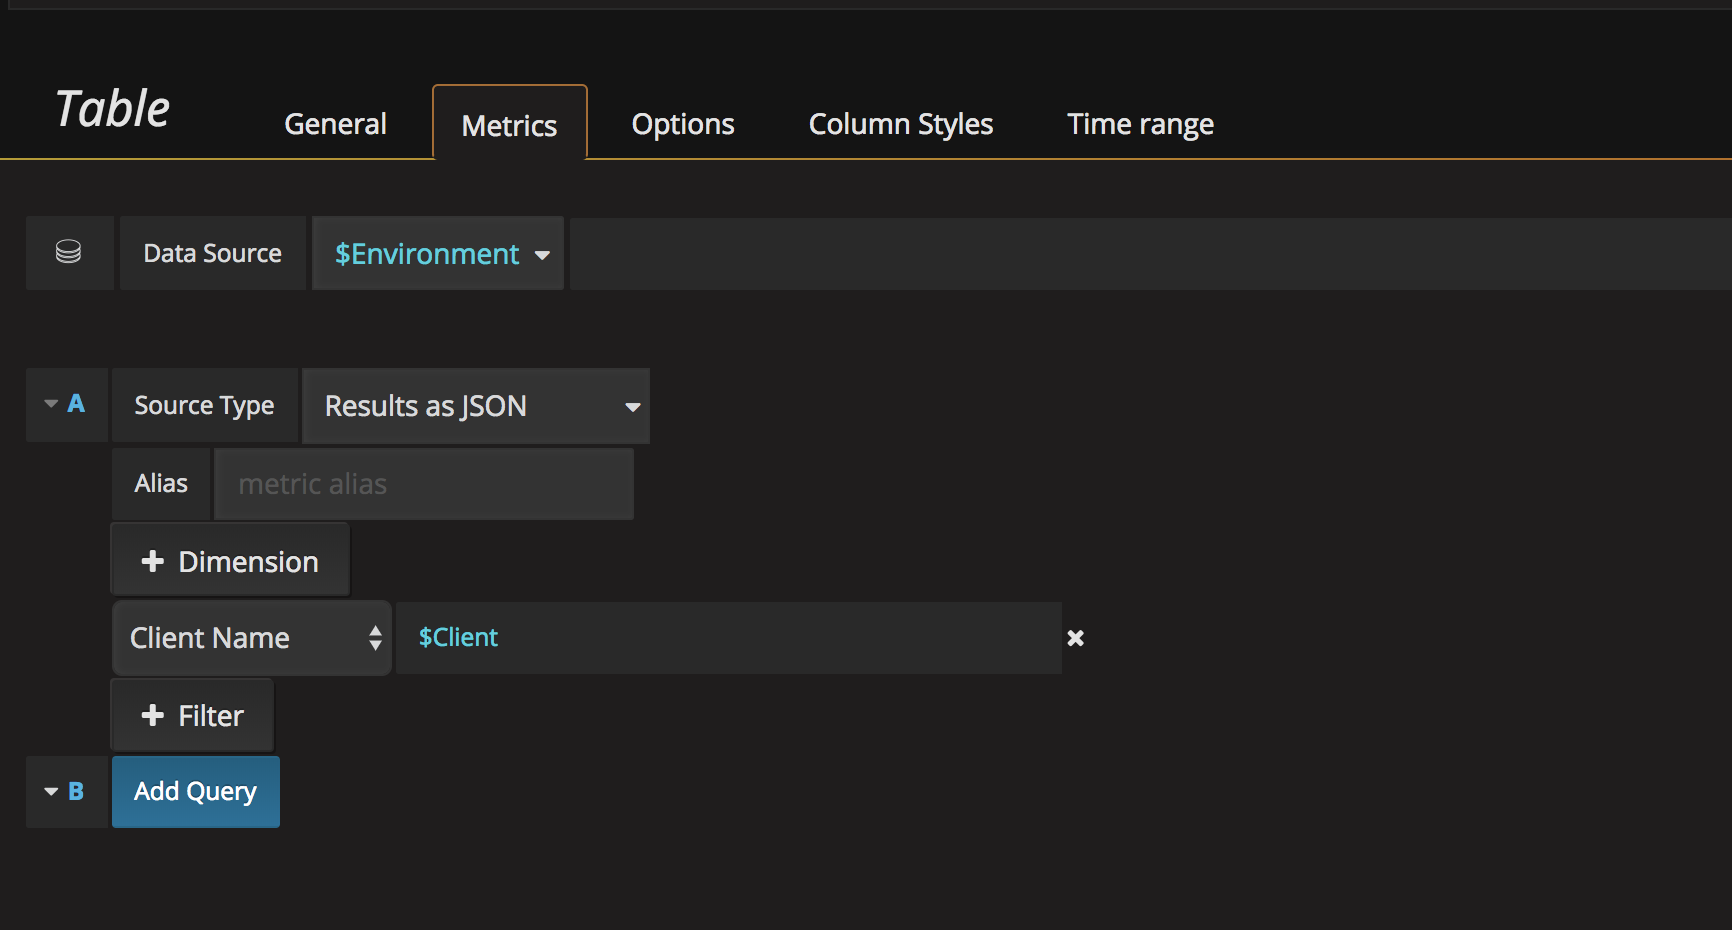
Once added, you can reference the template variable as you would with any other Grafana datasource. Here is an example showing how to limit a table panel to show just the selected client:
TODO
- overview panel
- source type: client history
- needs dimension: check_name filter
- and min/max/current/avg/total selector
- source type: aggregates, aggregate mode: list
- need dimension to pick aggregate field “checks/clients/crit/ok/stale/etc”
- and min/max/current/avg/total selector
Grafana Cloud Free
- Free tier: Limited to 3 users
- Paid plans: $55 / user / month above included usage
- Access to all Enterprise Plugins
- Fully managed service (not available to self-manage)
Self-hosted Grafana Enterprise
- Access to all Enterprise plugins
- All Grafana Enterprise features
- Self-manage on your own infrastructure
Installing sensu on Grafana Cloud:
Installing plugins on a Grafana Cloud instance is a one-click install; same with updates. Cool, right?
Note that it could take up to 1 minute to see the plugin show up in your Grafana.
Warning
Plugin installation from this page will be removed in February 2026. Use the Plugin Catalog in your Grafana instance instead. Refer to Install a plugin in the Grafana documentation for more information.
Installing plugins on a Grafana Cloud instance is a one-click install; same with updates. Cool, right?
Note that it could take up to 1 minute to see the plugin show up in your Grafana.
Installing plugins on a Grafana Cloud instance is a one-click install; same with updates. Cool, right?
Note that it could take up to 1 minute to see the plugin show up in your Grafana.
Warning
Plugin installation from this page will be removed in February 2026. Use the Plugin Catalog in your Grafana instance instead. Refer to Install a plugin in the Grafana documentation for more information.
Installing plugins on a Grafana Cloud instance is a one-click install; same with updates. Cool, right?
Note that it could take up to 1 minute to see the plugin show up in your Grafana.
For more information, visit the docs on plugin installation.
Installing on a local Grafana:
For local instances, plugins are installed and updated via a simple CLI command. Plugins are not updated automatically, however you will be notified when updates are available right within your Grafana.
1. Install the Application
Use the grafana-cli tool to install sensu from the commandline:
grafana-cli plugins install The plugin will be installed into your grafana plugins directory; the default is /var/lib/grafana/plugins. More information on the cli tool.
Alternatively, you can manually download the .zip file for your architecture below and unpack it into your grafana plugins directory.
Alternatively, you can manually download the .zip file and unpack it into your grafana plugins directory.
2. Enable it
Next, log into your Grafana instance. Navigate to the Plugins section, found in your Grafana main menu.
Click the Apps tabs in the Plugins section and select the newly installed app.
To enable the app, click the Config tab. Follow the instructions provided with the application and click Enable. The app and any new UI pages are now accessible from within the main menu, as designed by the app creator.
If dashboards have been included with the application, they will attempt to be automatically installed. To view the dashboards, re-import or delete individual dashboards, click the Dashboards tab within the app page.
Change Log
All notable changes to this project will be documented in this file.
[1.0.5] - 2019-09-07
- Rerelease to correct commit reference error
[1.0.4] - 2019-09-06
- Conversion to grafana/toolkit
- Updated packages
[1.0.3] - 2019-01-10
Hotfix for angular dependencies in dist