
Monitor all your Redshift clusters in Grafana with the new Amazon Redshift data source plugin
This blog post was co-authored by Grafana Labs Software Engineer Andres Martinez, who works on the cloud data sources team, and Robbie Rolin, a Software Development Engineer on the Amazon Managed Grafana team.
In collaboration with the AWS team, we have recently released the new Redshift data source plugin for Grafana.
Amazon Redshift is the fastest and most widely used cloud data warehouse. It uses SQL to analyze structured and semi-structured data across data warehouses, operational databases, and data lakes by using AWS-designed hardware and machine learning.
And now, with this new plugin, users can visualize their Redshift queries in Grafana, taking full advantage of the wide range of visualization options that Grafana offers and combining them with other data from multiple sources in a single Grafana dashboard.
Redshift plugin features
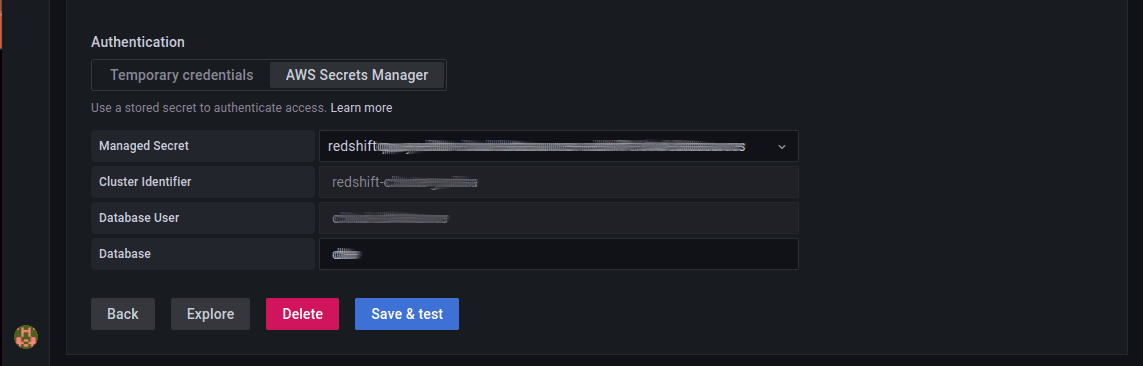
When you install the Redshift data source plugin for Grafana, you’ll be prompted to introduce some credentials in order to access your Redshift cluster. Here you can choose to either use Temporary Credentials or use an AWS Managed Secret. If you’re using Amazon Managed Grafana, you can use the AWS data source configuration to automatically create service-managed role permissions.
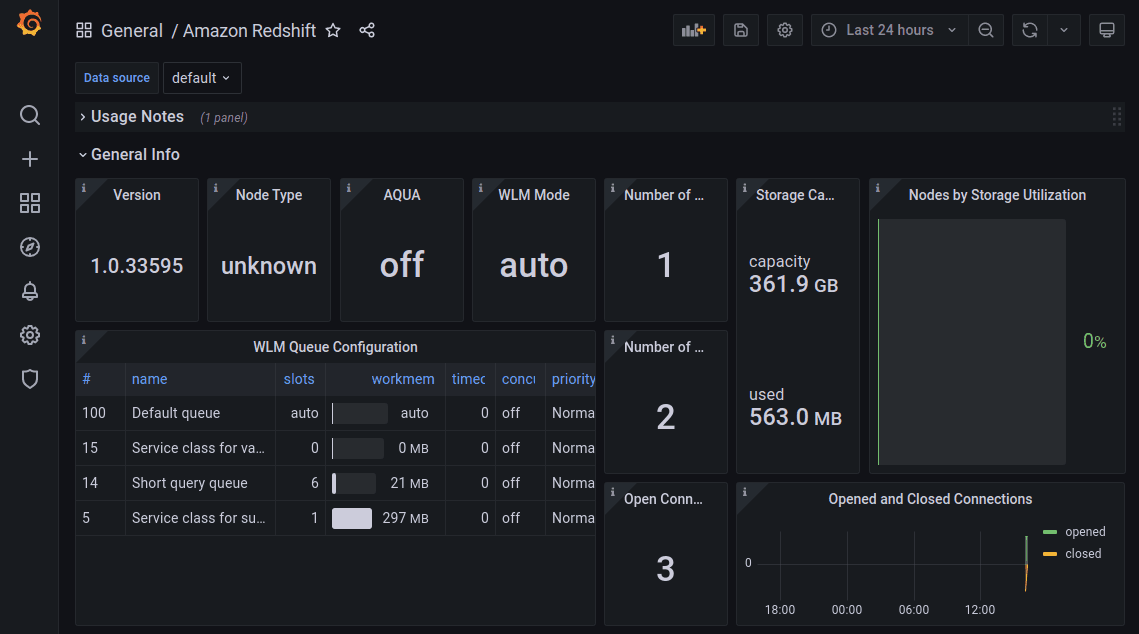
Once you have saved your changes, you can find a curated dashboard that is set up to monitor your Redshift cluster in the Dashboards tab. We will use that dashboard to demonstrate the rest of the plugin features!

The default dashboard gives you insight into the performance and health of your Redshift clusters.
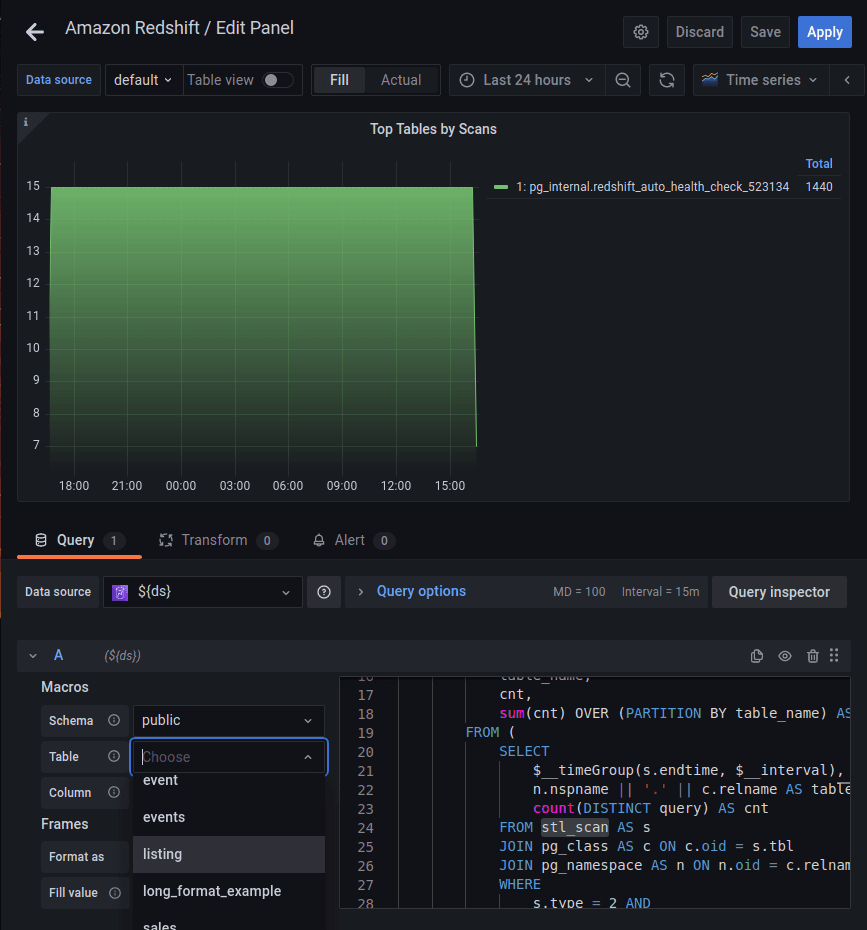
Query editor with macros
When we edit a panel from our performance dashboard, we see the query editor for the plugin comes with SQL syntax and autocompletion. The Schema, Table, and Column dropdown menus allow you to explore your data and automatically inject them in your query using macros. Check out the documentation for all the available macros that you can use.
It’s also possible to modify how the data frames are formatted, which is ideal for panel representations like time series.
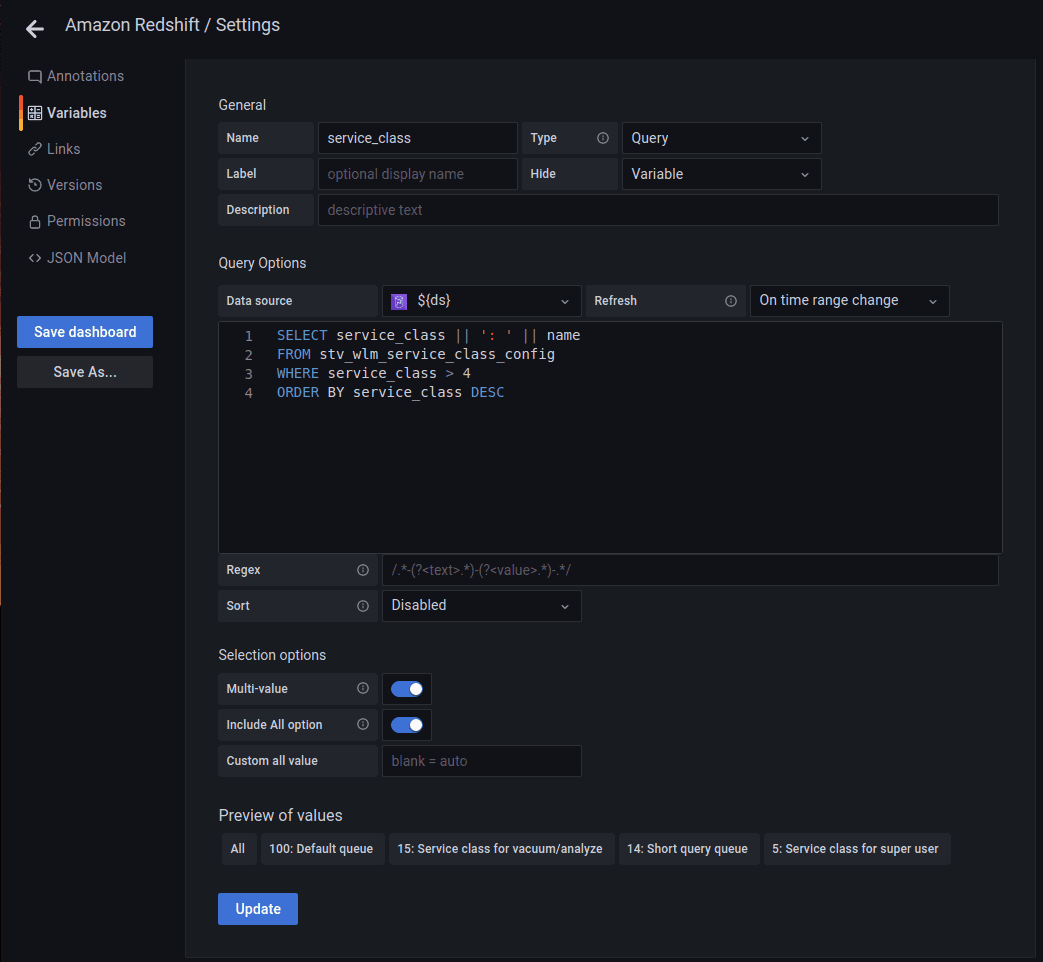
Template variables
In order to make your dashboard dynamic, template variables are really helpful. There are multiple template variable types (i.e., text values, data source lists), but you can also use Redshift to write queries and use the results as variables.
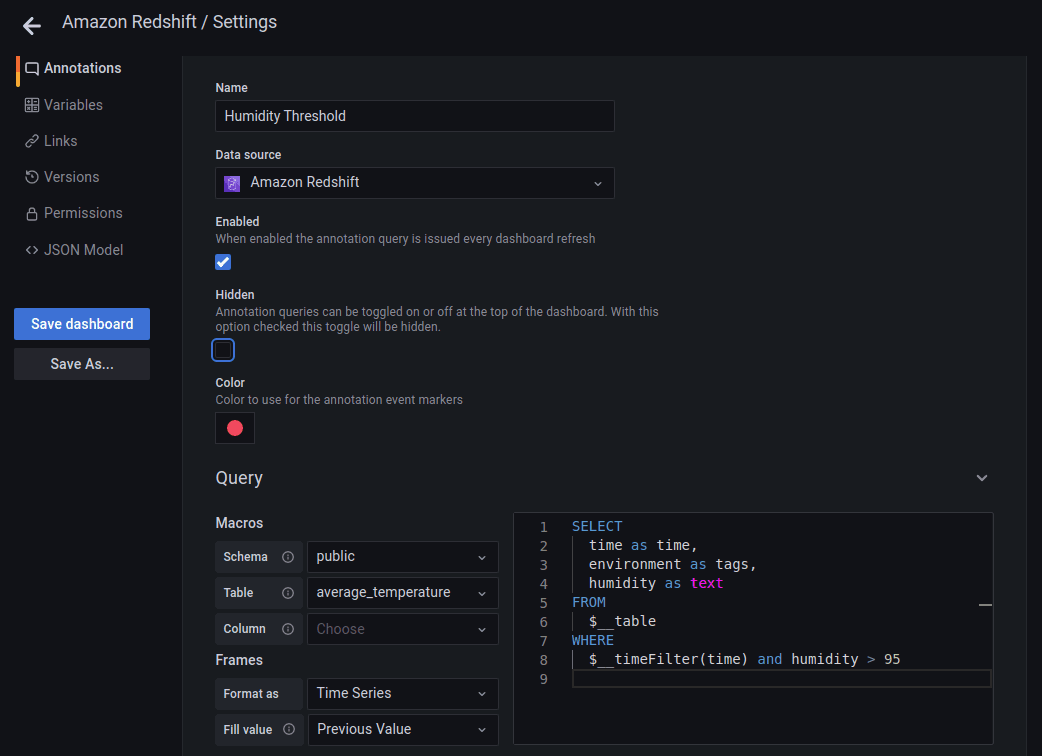
Annotations
It’s also possible to automatically annotate your panels based on the result of a Redshift query. For example, we can create annotations based on some weather data in our database:
Learn more about the Redshift plugin
You can learn more about the Redshift plugin for Grafana from the project’s plugin page. To learn more about using Redshift, you can visit Amazon’s overview documentation.

